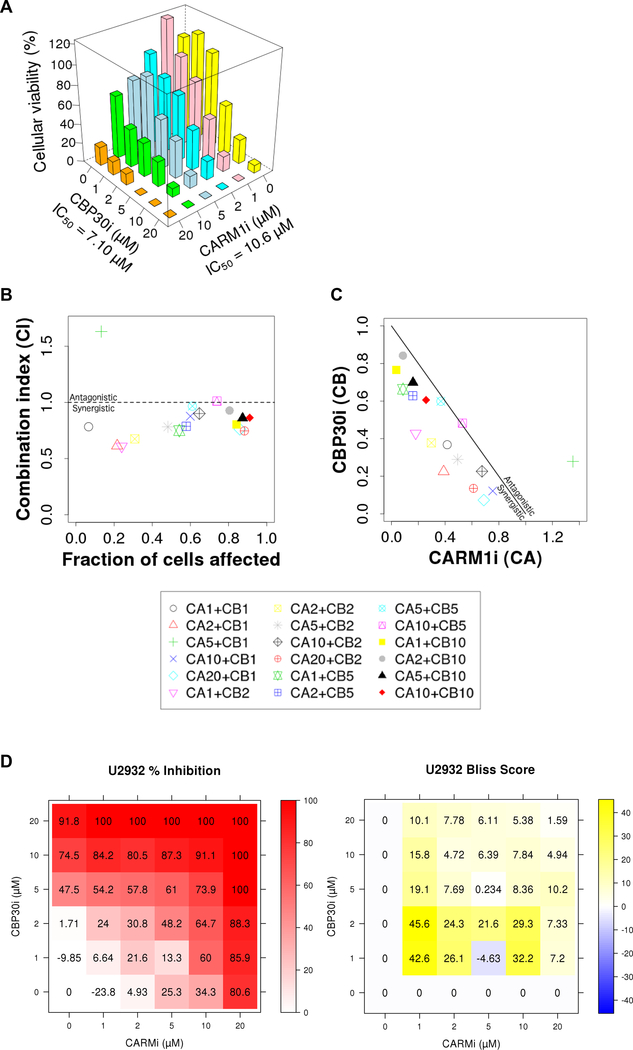
Figure 5. CARM1 and CBP/p300 small molecule inhibition display synergistic effects in human DLBCL cells.
A) Cellular viability of U2932 line treated with the indicated concentrations of CBP30 and CARM1iTP. All combinations of 0–20uM drug were tested, and measurements were taken at day 6 of treatment. n=3. B and C) Combination Index analysis of the effect-oriented (B), and dose-oriented (C) maps to evaluate synergism between CARM1iTP and CBP30i, as described previously (65). B) The combination index (CI) values were calculated using CompuSyn software (ComboSyn, Inc., Paramus, NJ, USA) as a function of the fraction of cells affected (Chou-Talalay plot). Values below 1 indicate synergistic interactions, while values above 1 indicate antagonistic interactions. (C) Normalized isobolograms (Chou-Chou plots) show the synergism for the indicated drug concentrations, the diagonal line corresponding to an additive effect. Data points falling on the lower left of this line indicate synergism, while those falling on the upper right indicate antagonism. The Key at the bottom represents the combination treatments used in μMs, with ‘CA’ representing CARM1iTP and ‘CB’ representing CBP30. Each symbol represents the mean of three biological replicates tested for each combination of CBP30 and CARM1iTP indicated. D) Bliss independence model detailing percent inhibition (left) and Bliss score (right) for each combination of CBP30 and CARM1iTP tested. Each value represents the mean of three biological replicates.

