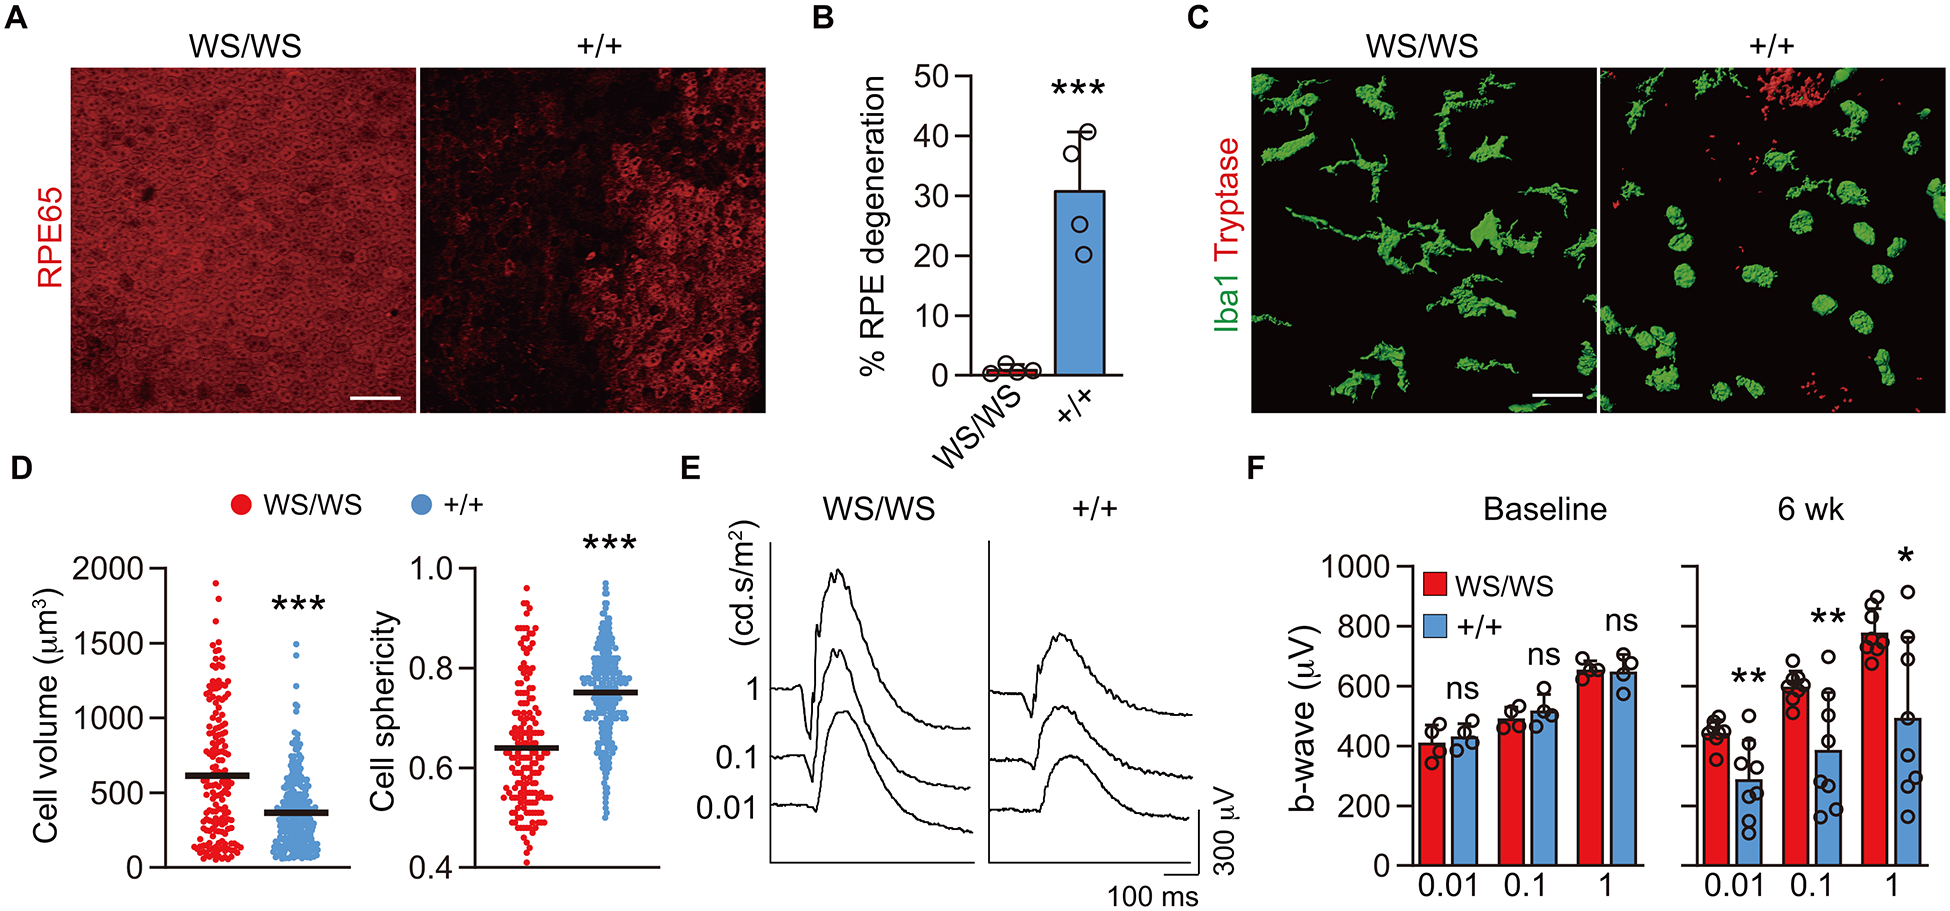
Figure 3.

Morphological analyses after 48/80 implantation in MC deficient rats and WT littermates. A, B) Choroidal whole mounts labeled for RPE65 at 6 wk post implantation of 48/80-hydrogel in MC deficient WsRCws/ws (WS/WS) and their WT littermate WsRC+/+ (+/+) rats. The graph shows quantification of percentage RPE degeneration (n = 4, per group). Scale bar, 100 μm. C) Images of three-dimensional volume renderings of macrophage/monocytes (Iba1+; green) and MCs (tryptase+; red) in the choroid. No MCs were detected in WsRCws/ws, while MCs were degranulated in WsRC+/+ WT rats at 6 wk. D) The graph shows comparison of volume and sphericity of Iba+ cells in WsRC+/+ (n = 327) and WsRCws/ws (n = 162). Scale bar, 50 μm. E, F) Representative scotopic electroretinogram (ERG) with the stimuli of 0.01, 0.1 and 1 cd.s/m2 at 6 wk. The graph shows b-wave amplitude with the stimulus of 0.01, 0.1 and 1 cd.s/m2 at baseline (n = 4, per group) and 6 wk post implantation (n = 8, per group). Data are mean ± SD. *P < 0.05, **P < 0.01, ***P < 0.001, 2-tailed, unpaired Student’s t test.
