Figure 5.

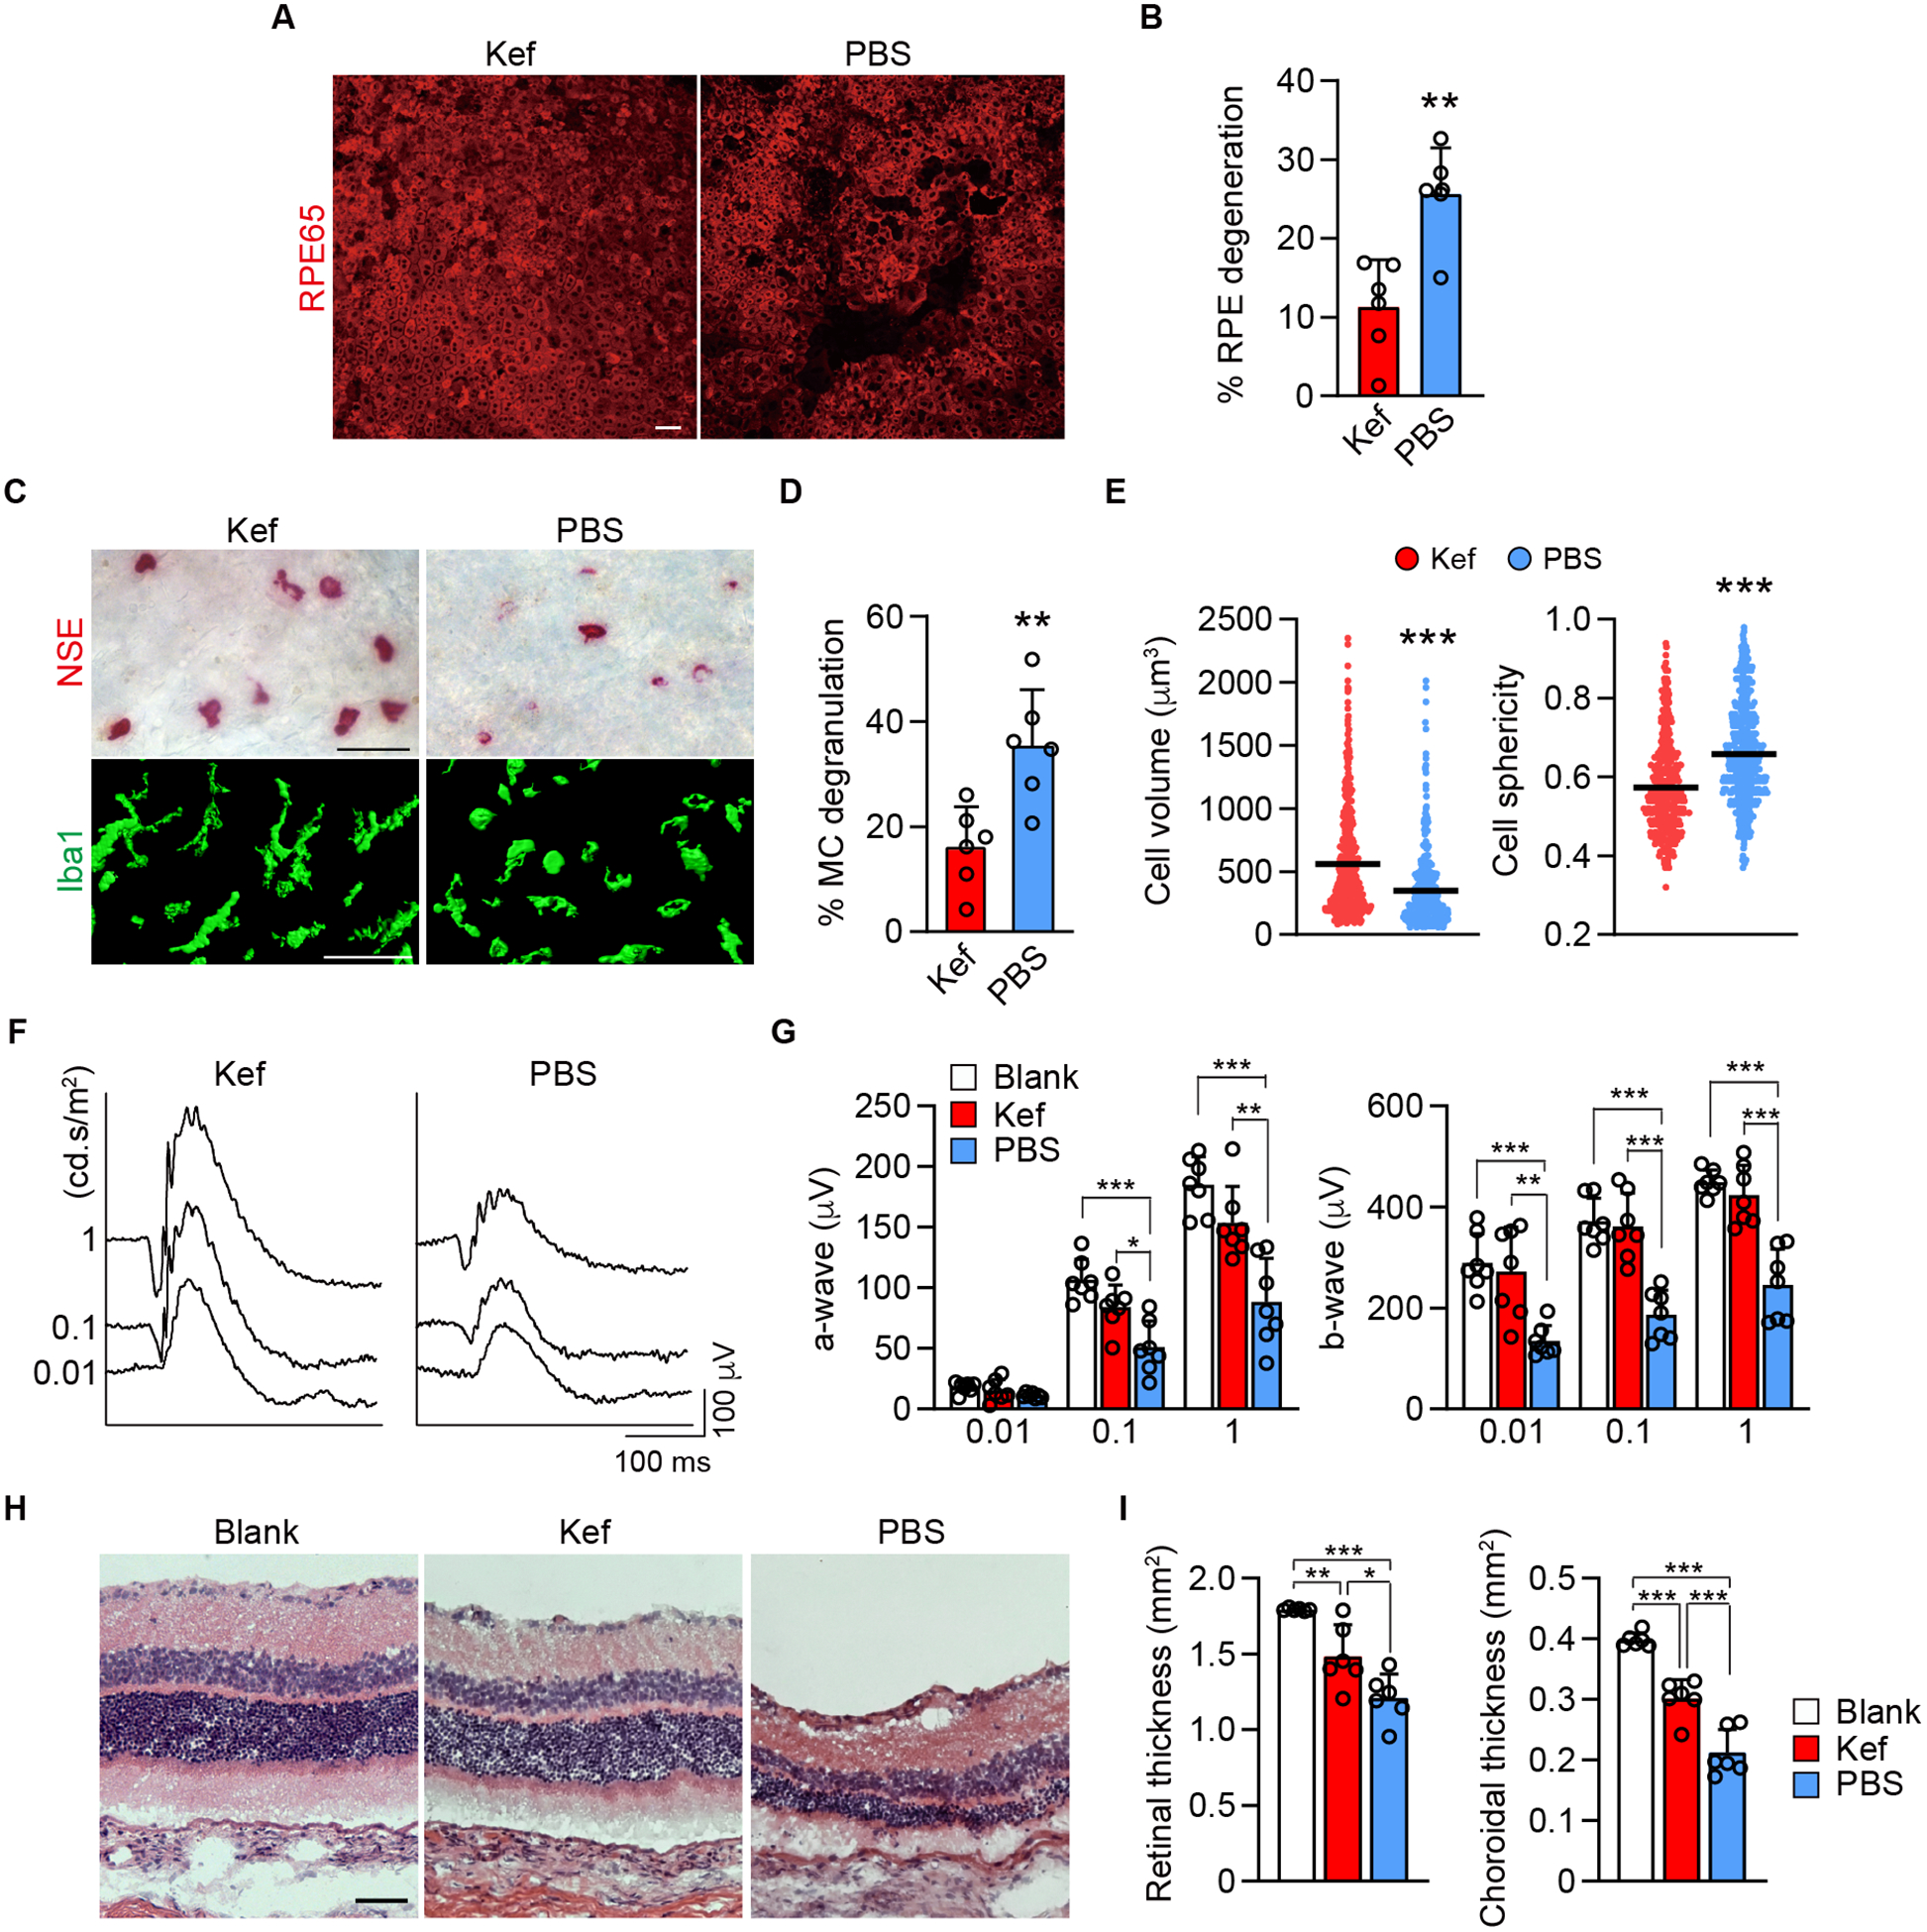
Results of quiescing MCs with the generic MC stabilizer, ketotifen fumarate, in the rat model. A, B) Choroidal whole mount labeled for RPE65 at 4 wk post implantation of 48/80-hydrogel in rats treated orally twice daily with ketotifen fumarate (Kef) or PBS. The graph shows quantification of percentage RPE degeneration in S/D rats (n = 6, per group). C-E) Bright field images of the choroid which show MCs (NSE+) (top) and the images of three-dimensional volume renderings shows choroidal macrophage (Iba1+) (bottom) in ketotifen fumarate and PBS treated rats 4 wk after implanting 48/80-hydrogel. The graph shows percentage of MC degranulation in the two groups (n = 6, per group) and comparison of the volume and sphericity of Iba1+ cells in the choroid after treating with ketotifen fumarate and PBS for 4 wk (ketotifen fumarate, n = 570; PBS, n = 601). F, G) Representative ERG with the stimuli of 0.01, 0.1 and 1 cd.s/m2 at 8 wk after treating with ketotifen fumarate or PBS in the 48/80 implanted eyes. The graph shows a- and b-wave amplitude blank-hydrogel implanted eyes and ketotifen fumarate or PBS treated eyes with the stimulus of 0.01, 0.1 and 1 cd.s/m2 at 8 wk post implantation (n = 7, per group). H, I) Representative H&E sections of blank-hydrogel implanted eye and treatments with ketotifen fumarate and PBS for 8 wk in the rat model. The graphs show area of retina and choroid evaluated in cross sections stained with picrosirius red (n = 6, per group). Data are mean ± SD. *P < 0.05, **P < 0.01, ***P < 0.001, 2-tailed, unpaired Student’s t test. Scale bars, 50 μm.
