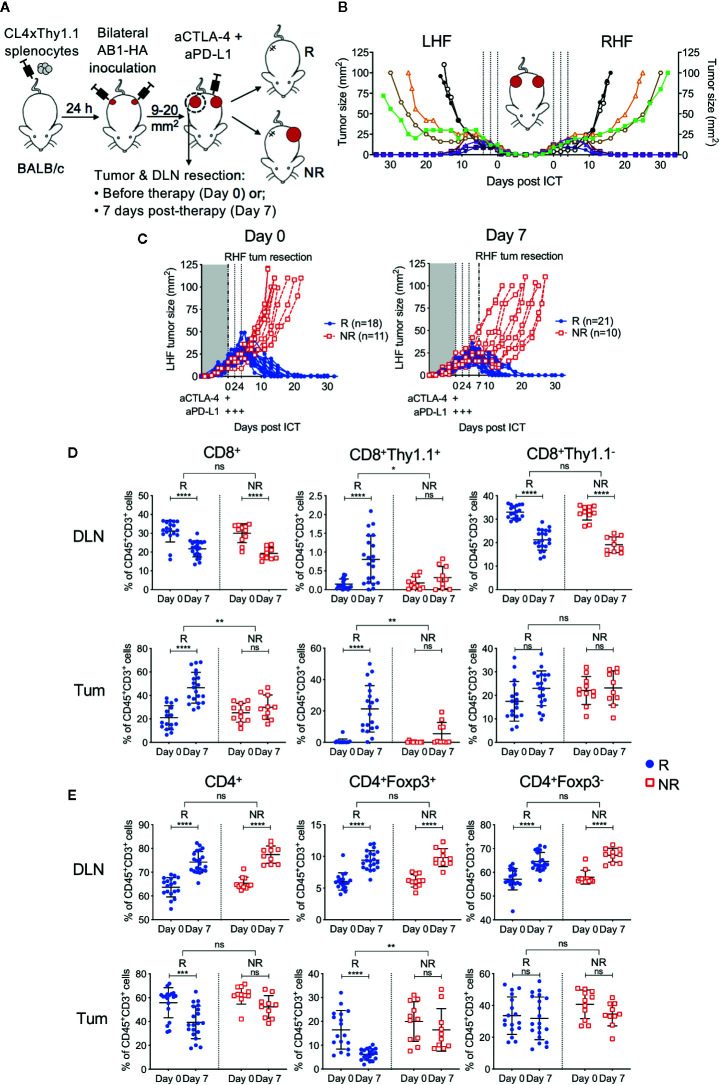
Figure 2.
Tumor antigen-specific CD8+ T cells increase in ICT responding DLN and tumors. (A) Experimental timeline. CL4xThy1.1 splenocytes were adoptively transferred into BALB/c mice one day prior to bilateral AB1-HA tumor inoculation. Right-hand flank (RHF) tumor (Tum) and draining lymph node (DLN) were surgically resected either pre- (day 0) or post-ICT (day 7). Left-hand flank (LHF) tumor was followed for ICT response. (B) Growth curves representing symmetrical growth and regression of bilateral AB1-HA tumors treated with ICT (n = 8; color-coded per mouse) or PBS (n = 2; black), without surgery. Dotted lines indicate days of treatment. (C) Growth curves of LHF tumors for mice that had their RHF tumors and DLNs resected at day 0 (left) or day 7 (right). Mice were characterized as responders (R; blue) or non-responders (NR; red). Dotted lines indicate days of treatment. Pre (Day 0) and post (day 7) treatment frequencies of total CD8+, CD8+Thy1.1+ and CD8+Thy1.1− (D); total CD4+, CD4+Foxp3+ and CD4+Foxp3- T cells (E) in resected DLNs (top) and tumors (bottom) of responding and non-responders. Data represented as mean ± SD, summary of five independent experiments. Two-way ANOVAs were used to compare the magnitude of difference between responders and non-responders, with Tukey’s multiple-comparisons to compare pre- and post-treatment frequencies within each group; *P ≤ 0.05, **P ≤ 0.01, ***P ≤ 0.001, ****P ≤ 0.0001.

