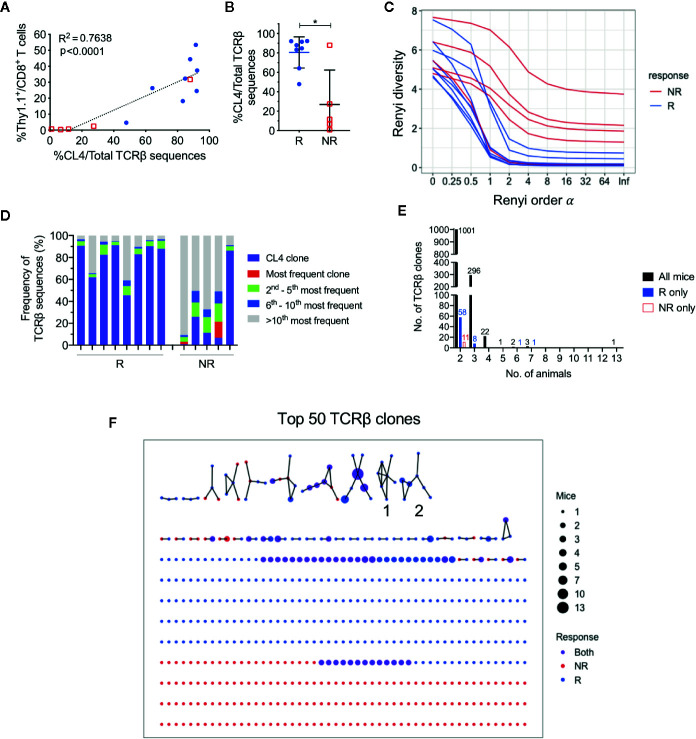
Figure 3.
CL4 transgenic TCRβ clone dominated post-treatment CD8+ TIL TCRβ repertoire in responding animals. (A) Linear regression analysis between the CL4 TCRβ clone frequency in TCRβ sequencing and the frequency of CD8+Thy1.1+ T cells analyzed in flow cytometry. (B) Dot plot representing the CL4 TCRβ clone frequencies in responders (R; blue) and non-responders (NR; red). (C) Graph of Renyi diversity profiles for each TCRβ repertoire. The scale of Renyi order α corresponds to calculated diversity metrics. α = 0 indicates the richness of the repertoire (number of unique TCRβ clones). Shannon’s diversity index corresponds to α = 1. Each line represents the Renyi entropy of one animal, and a steeper gradient between α = 0 and 1 represents a less diverse repertoire. (D) Bar graph displaying proportions of the 10 most frequent TCRβ clones in responders and non-responders. Each bar represents the TCRβ repertoire of one animal. CL4 clone (purple) is the most frequent clone in 11/13 animals. (E) Bar graphs representing the number of shared TCRβ clones between 2 or more animals. Shared clones are separated into overlap within only responders (blue), only non-responders (red), or all mice regardless of outcome (black). (F) Network analysis of the top 50 most abundant TCRβ clones for each animal. Each node represents a unique CDR3 TCRβ sequence (TCRβ clone) and each edge defines a single amino acid difference (levenshtein distance of 1). Size of each node represents the number of mice that have the TCRβ clone in their repertoire and nodes are colored by presence of TCRβ clone in only responders (blue), only non-responders (red) or both groups (purple). Data is shown as mean ± SD where appropriate; R (n = 8) and NR (n = 5) were sampled from three independent experiments; Mann-Whitney U tests; *P ≤ 0.05.

