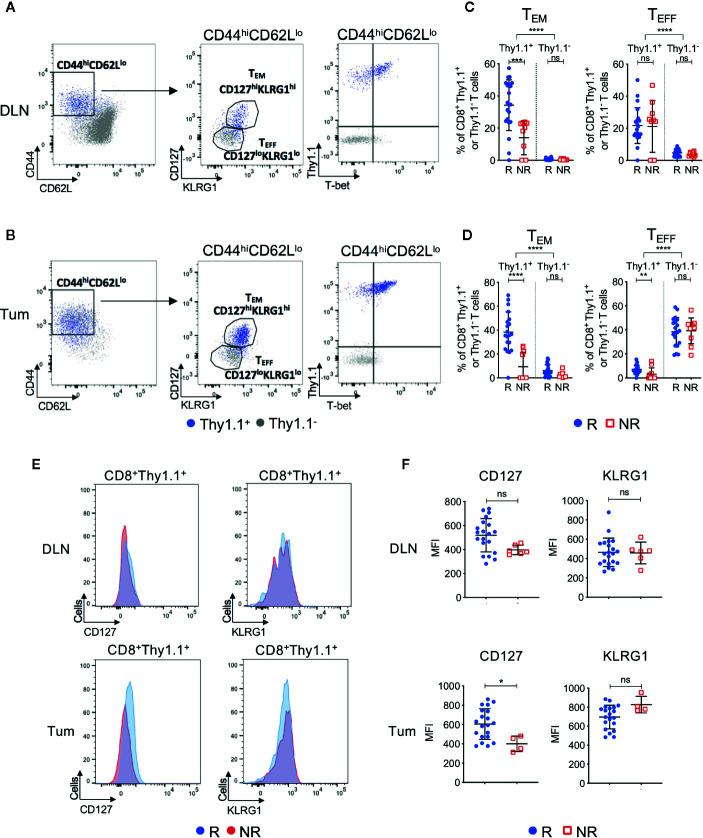
Figure 4.
Tumor infiltrating tumor antigen-specific CD8+ T cells acquire an effector memory phenotype in ICT responding animals. Representative FACs plots comparing CD8+Thy1.1+ (blue) and CD8+Thy1.1− (gray) T cell phenotype in post-treatment (A) DLNs and (B) tumors. Cells were analyzed for CD44, CD62L, CD127, KLRG1 and T-bet expression. Gates on the FACS plot represent effector memory (TEM; CD44hiCD62LloCD127hiKLRG1hi) and effector (TEFF; CD44hiCD62LloCD127loKLRG1lo) T cell subsets. Graphs representing frequencies of tumor antigen-specific (CD8+Thy1.1+) and endogenous (CD8+Thy1.1−) T cells that exhibit TEM or TEFF phenotypes in (C) DLNs and (D) tumors, grouped by response/non-response to ICT. (E) Representative histograms comparing CD127 and KLRG1 expression on activated (CD44hiCD62Llo) CD8+Thy1.1+ T cells between responding and non-responding DLNs (top) and tumors (bottom). (F) Median fluorescence intensity (MFI) expression of CD127 and KLRG1 on CD8+Thy1.1+ T cells in DLNs (top) and tumors (bottom) represented as dot plots. Data shown as mean ± SD. Mann-Whitney U tests were used to compare between both responders and non-responders, and between Thy1.1+ and Thy1.1− T cells for each T cell phenotype; *P ≤ 0.05, **P ≤ 0.01, ***P ≤ 0.001, ****P ≤ 0.0001.

