Figure 5.
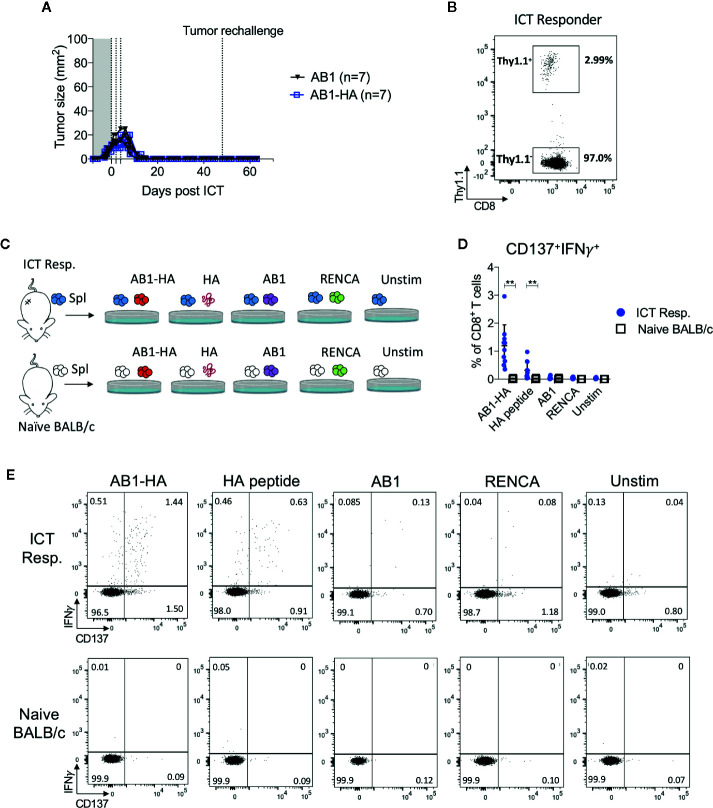
ICT responders develop a tumor antigen-specific memory T cell response. (A) Representative tumor growth curves of ICT responders re-challenged with AB1-HA or AB1 tumor cells 30 days after the primary tumor regressed to 0 mm2. (B) Representative FACs plot of CD8+Thy1.1+ T cells from splenocytes from an ICT responder, 15 days after AB1-HA tumor re-challenge. (C) Ex vivo co-culture setup to assess antigen-specific T cell responses. Splenocytes from ICT responders or naive BALB/c mice were co-cultured with AB1-HA, AB1, RENCA tumor cells, or HA peptide. (D) Dot plots and (E) representative flow cytometry plots, showing percentages of CD8+ T cells that co-expressed IFNγ and CD137 for each culture condition. Data shown as mean ± SD, summary of two independent experiments; ICT responders: n = 10; Naïve BALB/c: n = 4. Mann-Whitney U tests; **P ≤ 0.01.

