
FIGURE 4.
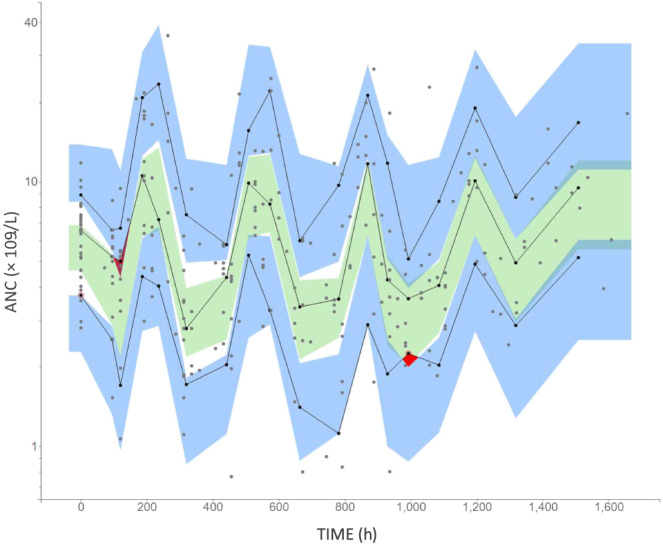
Visual predictive checks of absolute neutrophil count for the final model based on 1000 simulations of study design on patients receiving daily granulocyte colony‐stimulating factor after FOLFIRINOX regimen. Black dots represent the observed data. Red areas and circles represent deviation of the model predictions from mimicking the observed data. Solid lines refer to the median, 10th and 90th percentiles of observed data. Green area is the median 90% confidence interval and blue areas are 90% confidence interval for 10th and 90th percentiles of the model predictions. ANC: absolute neutrophil count