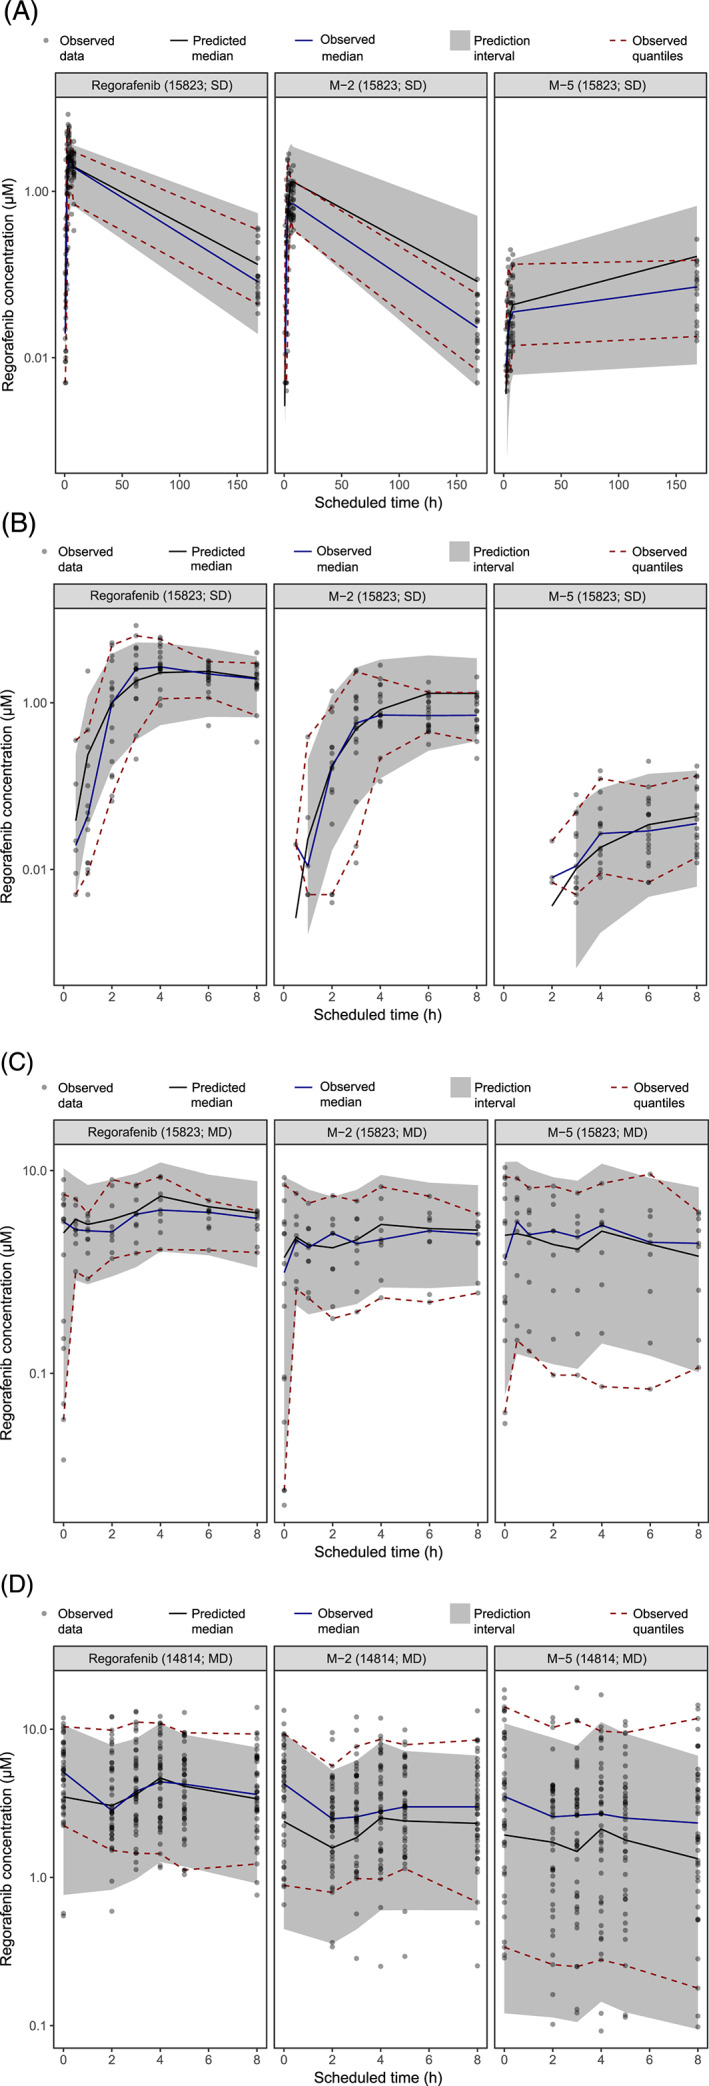
FIGURE 2.

VPCs for the phase 1 regorafenib–metabolite enterohepatic circulation population PK model. Predicted concentrations of regorafenib and its metabolites, M‐2 and M‐5, after a single dose (A and B) and multiple doses (C and D) in two phase 1 studies [14814 (n = 44) and 15823 (n = 18)]. Black dots represent observed concentrations in the two phase 1 studies. The grey area represents the 90% prediction interval; the red dashed lines represent the 5% and 95% percentiles of the observed concentrations. The black lines represent the median of the model predictions, and the blue lines represent the median of the observations.
MD, multiple dose; PK, pharmacokinetic; SD, single dose; VPC, visual predictive check
