FIGURE 4.

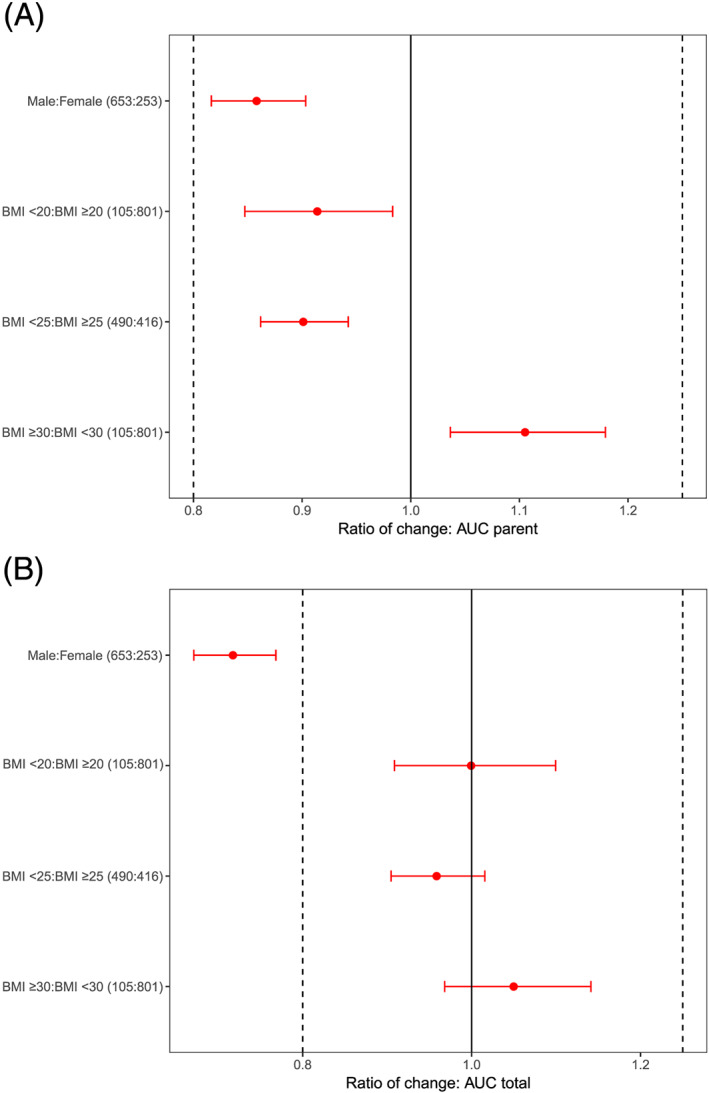
Contribution of sex and BMI covariates to the variability of exposure in phase 3 studies determined based on post hoc estimates from the final model and shown as a distribution of the exposure of (A) parent regorafenib AUC at steady state of nominal dosing (160 mg day−1), and (B) protein binding corrected total AUC (parent, M‐2 and M‐5). Horizontal red dots and bars are the median and 90% CI, respectively, of the ratio by dichotomized variable of AUC0‐24h,ss geometric means. The median and CI were obtained by sampling 10,000 replicate trials based on the individual AUC0‐24h,ss values with replacement, per group. Individual AUC0‐24h,ss were derived from the individual clearance estimates using the final PK model. Vertical lines are commonly used bioequivalence boundaries 0.8–1.25.
AUC, area under curve; BMI, body mass index; CI, confidence interval; PK, pharmacokinetic; ss, steady state
