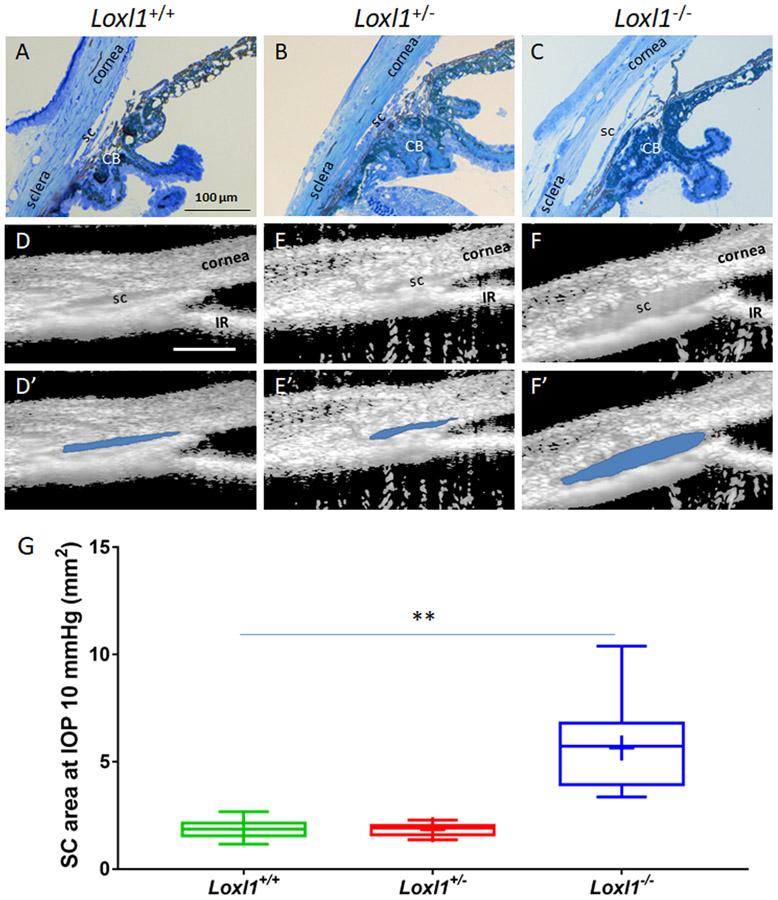
Figure 4. A dramatically enlarged Schlemm’s canal lumen is present in Loxl1−/− mice.
(A-C) Loxl1−/−, Loxl1+/− and Loxl1+/+ mouse anterior segments were fixed, sagittally sectioned, stained with methylene blue and imaged (n=3 for Loxl1+/+ and Loxl1+/−, n=4 for Loxl1−/−). (D-F) Cross-sectional images from living Loxl1−/−, Loxl1+/− and Loxl1+/+ mice were recorded using SD-OCT and SC lumen was segmented using custom software. (D’-F’) The segmented SC lumen is highlighted in blue corresponding to panels (D-F). (G) Quantitative analysis of SC luminal cross-sectional areas indicated a significantly larger SC in the Loxl1−/− mice when compared to Loxl1+/− mice (**p=0.0001; n=10 eyes for both Loxl1+/+ and Loxl1+/−mice, n=11 eyes for Loxl1−/−mice). The central line in box and whisker plots represents the median, the top and bottom edges are 25th and 75th percentiles, the whiskers extend to the most extreme data points not considered outliers and “+” indicates the mean. Scale bar=100μm.

