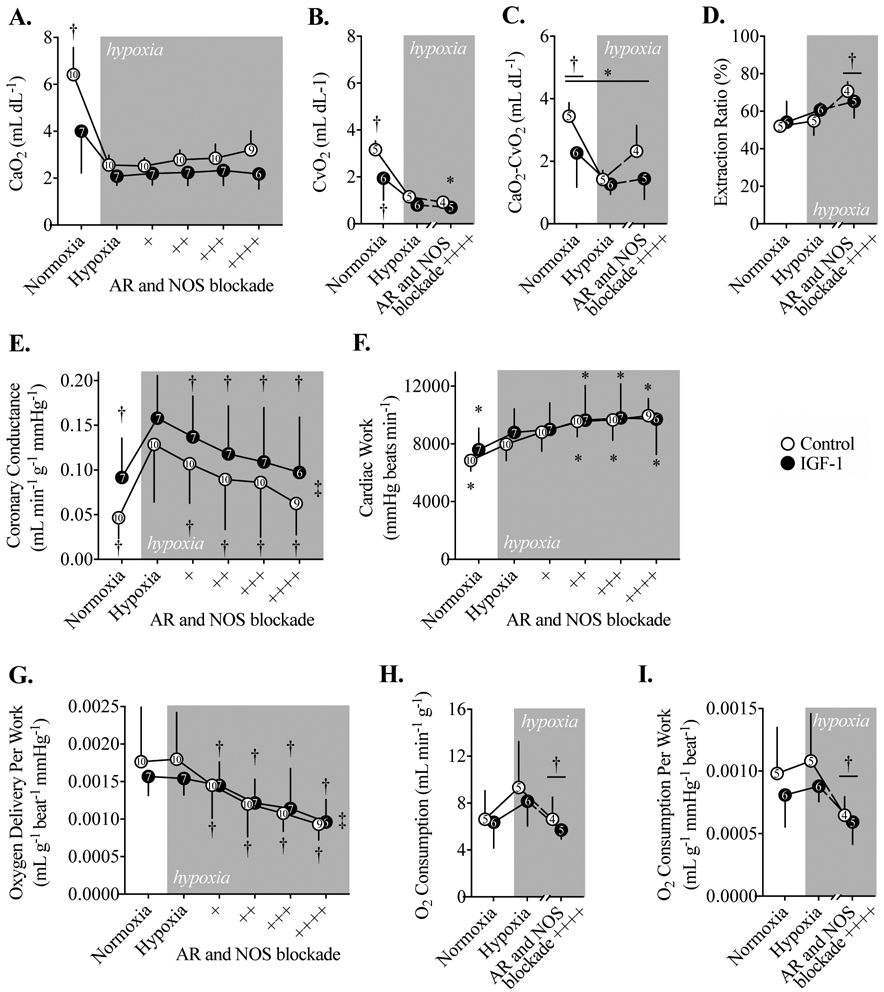
Figure 4. Blood O2 contents and coronary hemodynamics during acute hypoxia on study day 7.

A) Arterial O2 content (CaO2) in Control and IGF-1-treated fetal sheep during acute hypoxia, and with adenosine receptor (AR) and nitric oxide synthase (NOS) blockade. B) Coronary sinus O2 content (CvO2) during acute hypoxia and maximum AR and NOS blockade. C) The difference between CaO2 and CvO2, which is the O2 extracted by the myocardium. D) Coronary extraction ratio, the percent of O2 extracted from arterial blood by the myocardium. E) Coronary conductance during acute hypoxia. F) Cardiac work, calculated as the double product. G) Myocardial O2 delivered as a function of cardiac work during acute hypoxia, and with AR and NOS blockade. H) Myocardial O2 consumption, and I) myocardial O2 consumption per work. Number of animals is shown within symbols. Different from *Control, †Hypoxia timepoint within-group by the Holm-Šidák multiple comparisons test following a significant interaction term by 2-way mixed effects analysis (a symbol and bar denotes differences at this level), and significant ‡linear trend across columns (P<0.05). Data are shown as mean ± SD.
