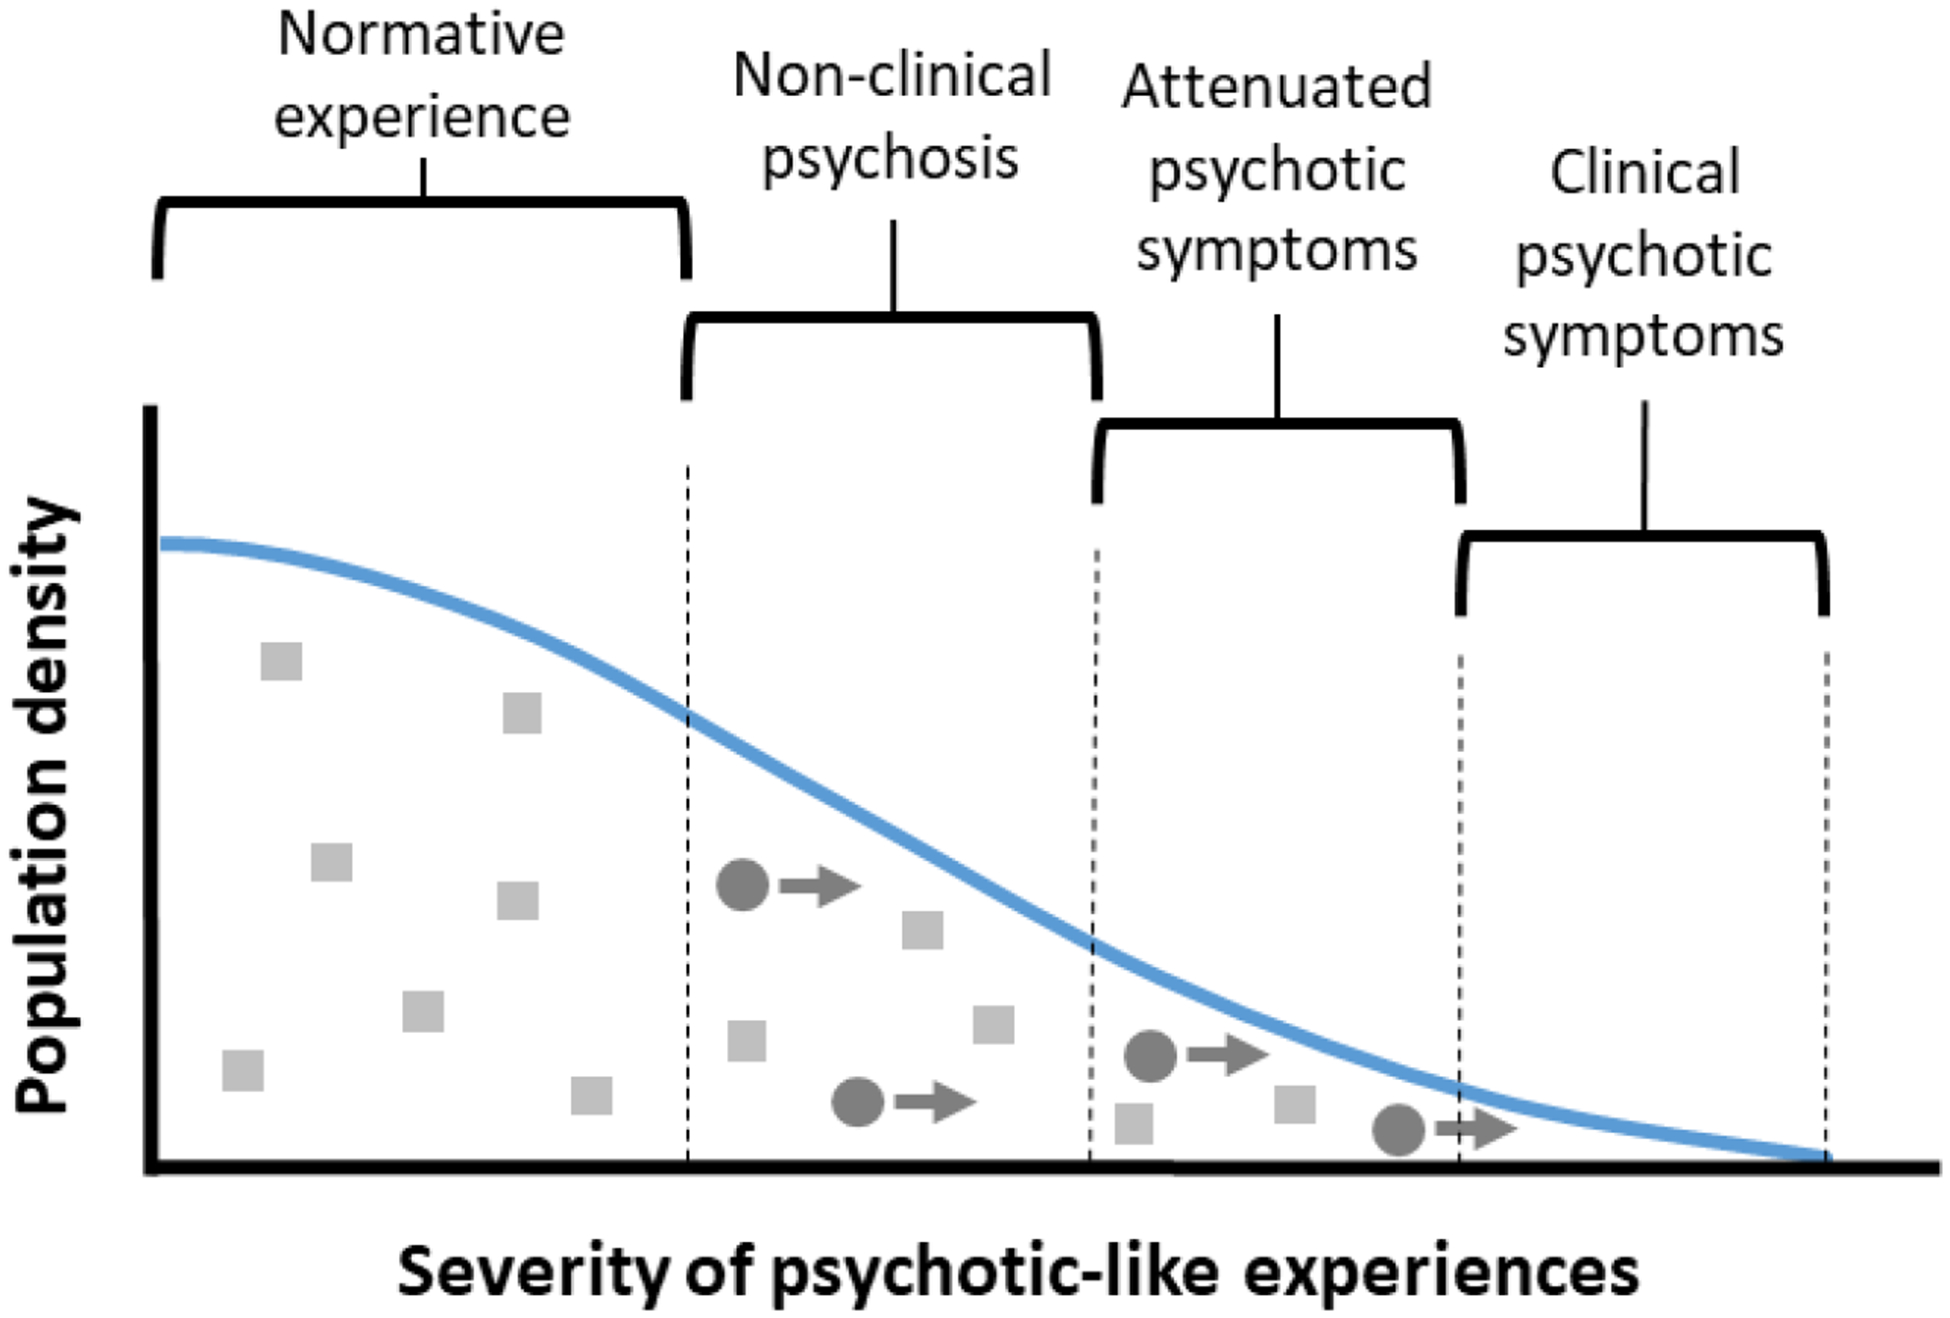
Figure 1.

A hypothetical population distribution of psychotic-like experiences (PLEs) in a fully dimensional model of psychosis. In this model, PLEs are continuously distributed. As they become more severe, they are classified first as non-clinical psychosis, then as attenuated psychotic symptoms, and finally as clinical psychotic symptoms. Light-coloured squares represent individuals who experience stable, trait-like levels of PLEs; dark-coloured circles represent individuals who experience increasingly severe PLEs over time and are more likely to convert to a psychotic disorder.
