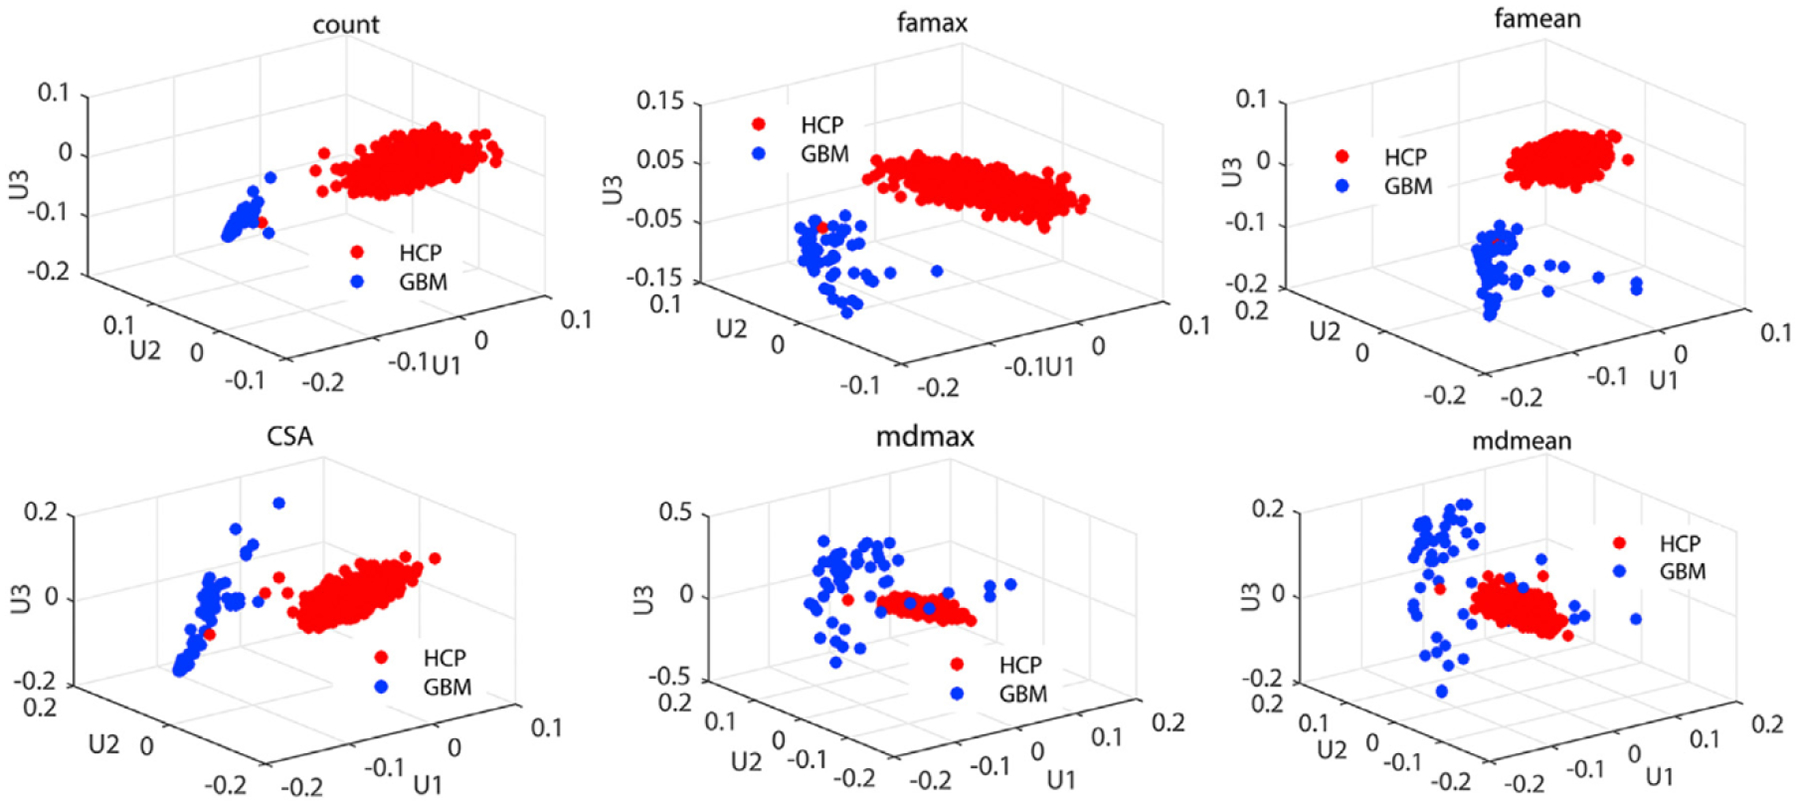
Fig. 9.

Results from the TN-PCA analysis of comparing between the GBM group and the HCP group: the top three PC scores of six diffusion properties including the count of streamlines, CSA, mean and max values of FA, and mean and max values of MD for the GBM group and the healthy group.
