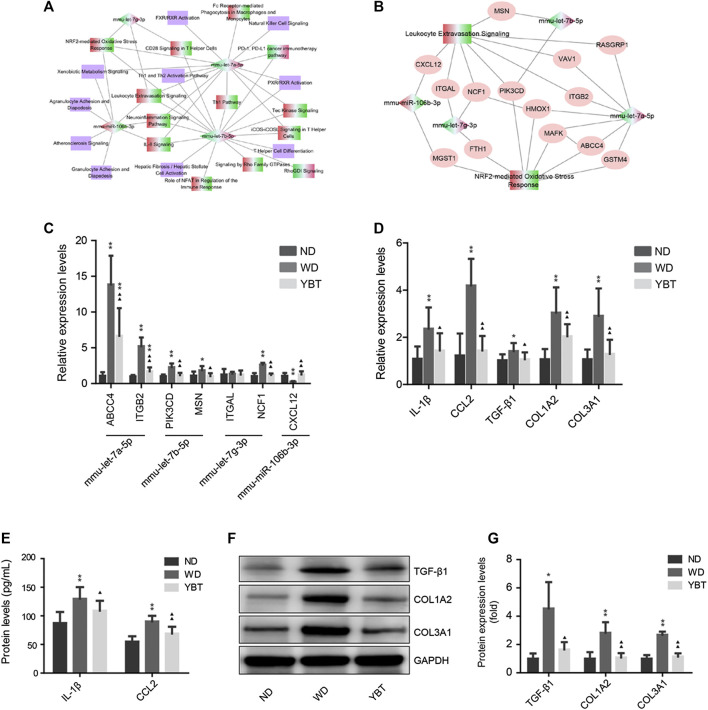
FIGURE 8.
qRT-PCR verification of potential target genes, inflammation and fibrosis related genes. (A). Simplified target MicroRNAs (miRNA)-pathway network obtained from panel 7B. The diamond denotes the target miRNA and the rectangle represents the canonical pathway. The red-green color presents the node was up-regulated in Western diet (WD) vs. normal diet (ND) group and down-regulated in Yiqi-Bushen-Tiaozhi (YBT) vs. WD group; the green-red color indicates the opposite situation. The purple color denotes the z-score of the pathway was unknown. (B). Target miRNA-pathway network of Leukotyte Excetravation Sinaling Pathway and NRF2-mediated Oxiedativ Stress Response Pathway. The diamond denotes the target miRNA and the rectangle represents the canonical pathway. The ovals represent the potential target gene of the miRNAs. The red-green color presents the node was up-regulated in WD vs. ND group and down-regulated in YBT vs. WD group; the green-red color indicates the opposite situation. (C). qRT-PCR verification of partial potential target genes of panel 8B. β-actin was used as the internal control. (D). qRT-PCR verification of inflammation and fibrosis related genes. β-actin was used as the internal control. (E). The protein levels of IL-1β and CCL-2 were measured by liquid suspension array analysis. (F,G). Western blot analysis of the protein expression levels of TGF-βx, COL1A2 and COL3A1. GAPDH was served as the loading control. Compared with ND group, ∗ p < 0.05, ∗∗ p < 0.01; compared with WD group, ▲ p < 0.05, ▲▲ p < 0.01; n = 8/group.

