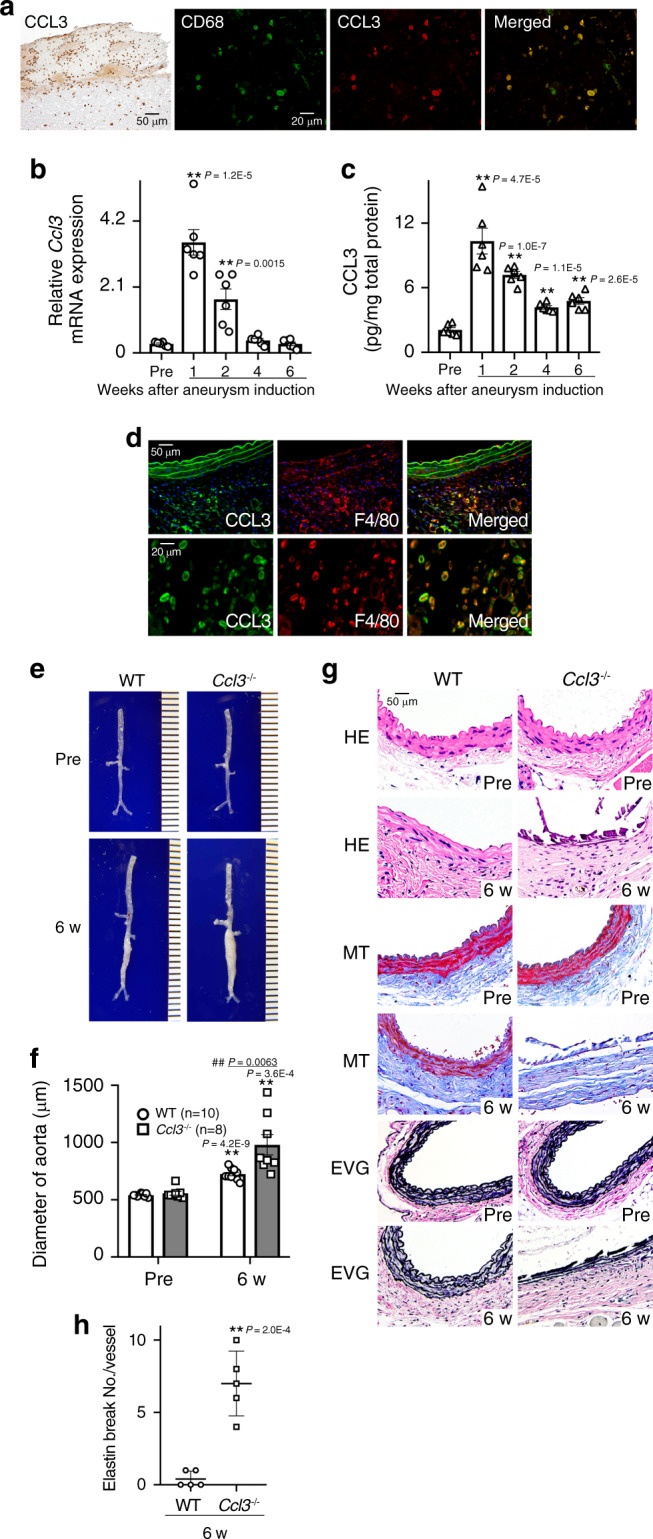
Fig. 1. Roles of CCL3 in AAA formation.

a CCL3 expression by CD68+ macrophages in human AAA samples (left panel, scale bar = 50 µm; other panels, scale bar = 20 µm). Representative results from 4 independent experiments are shown here. b–d Intra-aortic CCL3 expression in WT mice after CaCl2 treatment. b Intra-aortic Ccl3 expression (n = 6 in each time point). **P < 0.01, vs. pretreatment. c Intra-aortic CCL3 protein contents (n = 6 in each time point). **P < 0.01, vs. pretreatment. d Representative images of CCL3 expression by F4/80+ macrophages in the aortas from WT mice (upper panels, scale bar = 50 µm; lower panels, scale bar = 20 µm). Representative results from four independent experiments are shown here. Blue coloration, nuclear staining by DAPI. e Representative macroscopic appearances of aortas in WT and Ccl3−/− mice after CaCl2 treatment (from six independent experiments). f Aortic diameters were measured in WT and Ccl3−/− mice (n = 6 independent experiments). **P < 0.01, vs. pretreatment in each strain; ##P < 0.01, vs. WT-posttreatment. g Histopathological analysis of the aortas obtained from WT and Ccl3−/− mice after CaCl2 treatment. Representative results from five independent experiments are shown here. Scale bar, 50 µm. HE hematoxylin-eosin staining, MT Masson trichrome staining, EVG Elastica van Gieson staining. h Quantification of the number of elastin breaks per vessel. **P < 0.01, vs. WT mice. One-way ANOVA followed by Dunnett’s post-hoc test was used in (b) and (c). Unpaired two-sided Student’s t test was used in (f) and (h). Data are presented as mean values ± SEM.
