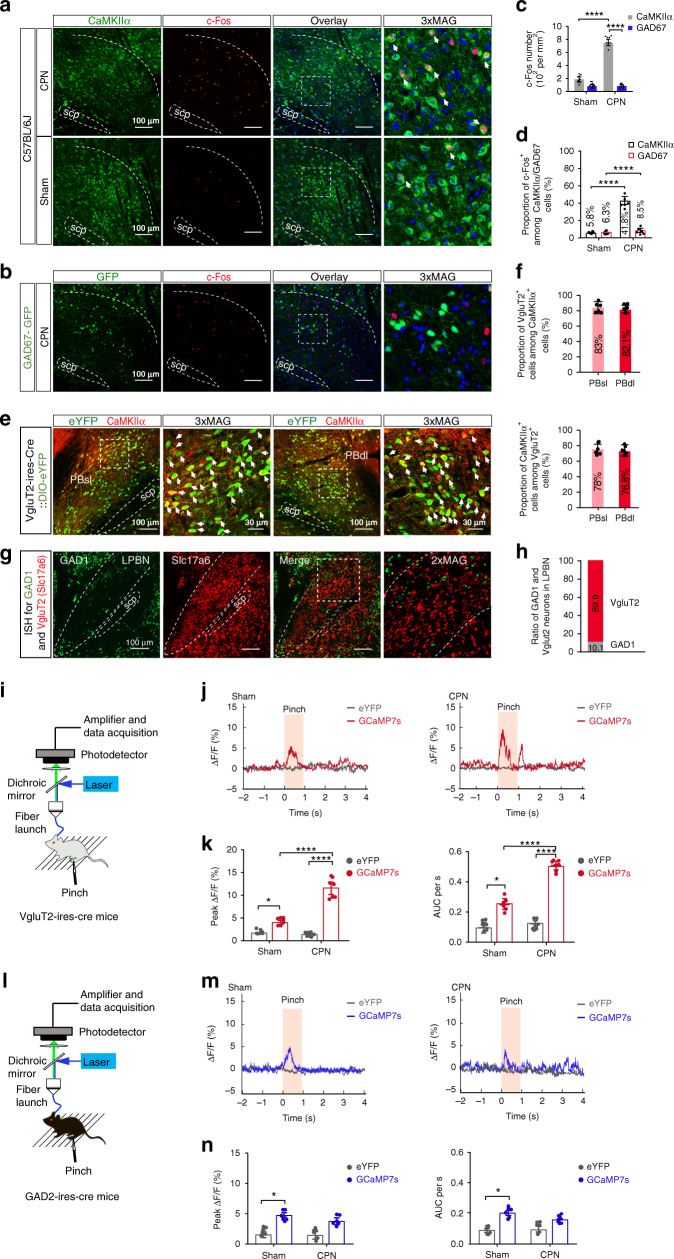
Fig. 1. CPN ligation activates glutamatergic LPBN neurons.
a Representative images of co-labeling (arrowheads) of CaMKIIα-positive neurons and c-Fos immunoreactivity in the LPBN (white dashed lines). Rightmost panels, 3 times magnification of the boxed areas in the left panels. Scale bars, 100 μm. b Example images showing c-Fos positive (red) and GAD67-GFP-expressing cells in the LPBN one week after CPN ligation. Rightmost panel, 3 times magnification of the boxed area in the left panel. Blue, DAPI staining. Scale bars, 100 μm. c Density of c-Fos-positive cells in CaMKIIα-expressing and GAD67-GFP-expressing cells in the LPBN. d Proportions of CaMKIIα or GAD67-GFP-positive cells co-expressed with c-Fos in the LPBN. e Representative images of neurons expressing VgluT2-eYFP co-localize (arrows) with the CaMKIIα in PBsl (left two panels) and PBdl (right two panels). 3xMAG (the second and fourth panels), 3 times magnification of the boxed area in the first and the third panels, respectively. Scale bars, 100 μm and 30 μm (3xMAG). f Percentage of CaMKIIα-positive neurons that co-express VgluT2 (upper) and percentage of VgluT2-positive neurons that co-express CaMKIIα (lower). n = 898 (PBsl) and 856 (PBdl) neurons from 5 sections from 5 mice. g Representative in situ hybridization for the GAD1 (green) and VgluT2 (red, Slc17a6) in LPBN. Scale bars, 100 μm. Rightmost panels, 2× magnification of the boxed area in the left panel. h Ratio of Vglut2 or GAD1-positive neurons in the LPBN as in g. n = 6 sections from 6 mice. i, l Schematic of the recording system for the Ca2+ signal in LPBN neurons with fiber photometry in VgluT2-ires-Cre mice (i) and GAD2-ires-Cre mice (l). j, m Representative fluorescence signals (ΔF/F) of GCaMP7s (red) and eYFP (dark gray) recorded from glutamatergic (j) or GABAergic (m) LPBN neurons transfected with DIO-GCaMP7s or DIO-eYFP aligned to the pinch stimulation. k, n Averaged peak ΔF/F (left) and area under the curve (AUC) per second (right) of GCaMP7s and eYFP fluorescence signals from glutamatergic (k) or GABAergic (n) LPBN neurons. All data are presented as mean ± s.e.m. and error bars represent s.e.m. *P < 0.05 and ****P < 0.0001. See also Supplementary Table 1 for further statistical information. Source data are provided as a Source Data file.

