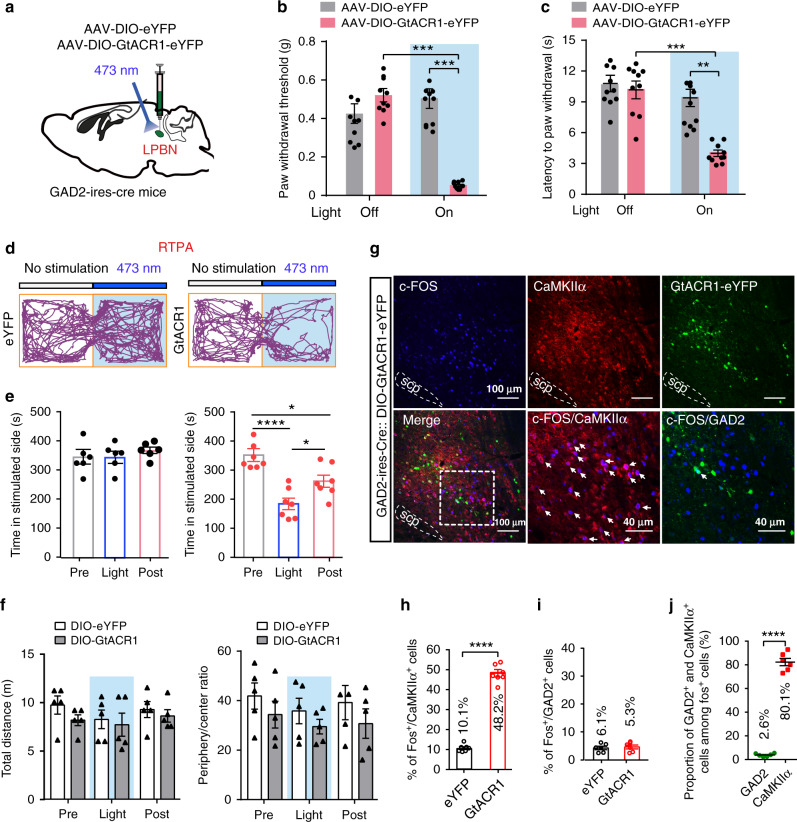
Fig. 7. Optogenetic inhibition of GABAergic LPBN neurons induced neuropathic pain-like symptoms.
a Schematic of the stereotaxic delivery of AAV-DIO-GtACR1-eYFP and AAV-DIO-eYFP into the LPBN of GAD2-ires-Cre mice and photoinhibition of GABAergic LPBN neurons. b Photoinhibition (473 nm, 40 Hz, 5 mW) of GABAergic LPBN neurons decreases the PWT in GAD2-ires-Cre mice transfected with AAV-DIO-GtACR1-eYFP. c Photoinhibition of GABAergic LPBN neurons decreases thermal withdraw latency in GAD2-ires-Cre mice transfected with AAV-DIO-GtACR1-eYFP. d Representative tracks in RTPA during 10-min illumination of the LPBN in GAD2-ires-Cre mice transfected with AAV-DIO-eYFP (left) or AAV-DIO-GtACR1-eYFP (right). e Quantification of time spent in the preferred chamber in the RTPA test before (Pre), during (Light), and after (Post) 10-min illumination of the LPBN in GAD2-ires-Cre mice transfected with AAV-DIO-eYFP (left) or AAV-DIO-GtACR1-eYFP (right). f Quantification of total distance moved (left) and ratio of time spent in the periphery and center (right) in the OFT before (Pre), during (Light), and after (Post) 10-min illumination of GABAergic LPBN neurons in GAD2-ires-Cre mice transfected with AAV-DIO-eYFP or AAV-DIO-GtACR1-eYFP. g Representative images of c-Fos expression (blue) 1 h after optogenetic inhibition (473 nm, 5 mW, 10 min) of GABAergic LPBN neurons in GAD2-ires-Cre mice transfected with AAV-DIO-GtACR1-eYFP. Lower middle and lower right panels show magnified views of the boxed area in the lower left panel. Note that c-Fos-positive cells co-localize with CaMKIIα (red), but not with GtACR1-eYFP (GAD2, green). Arrows indicate CaMKIIα+ neurons co-labeled with c-Fos. Scale bars, 100 μm and 40 μm (lower middle and lower right panels). h, i Quantification of cells expressing c-Fos induced by illumination of GABAergic LPBN neurons in GAD2-ires-Cre mice transfected with AAV-DIO-GtACR1-eYFP or AAV-DIO-eYFP as in g. j Proportion of c-Fos-positive cells that co-express GAD2-eYFP or CaMKIIα+ cells 1 h after optogenetic inhibition of GABAergic LPBN neurons as shown in g. All data are presented as mean ± s.e.m. and error bars represent s.e.m. *P < 0.05, **P < 0.01, ***P < 0.001, and ****P < 0.0001. See also Supplementary Table 1 for further statistical information. Source data are provided as a Source Data file.

