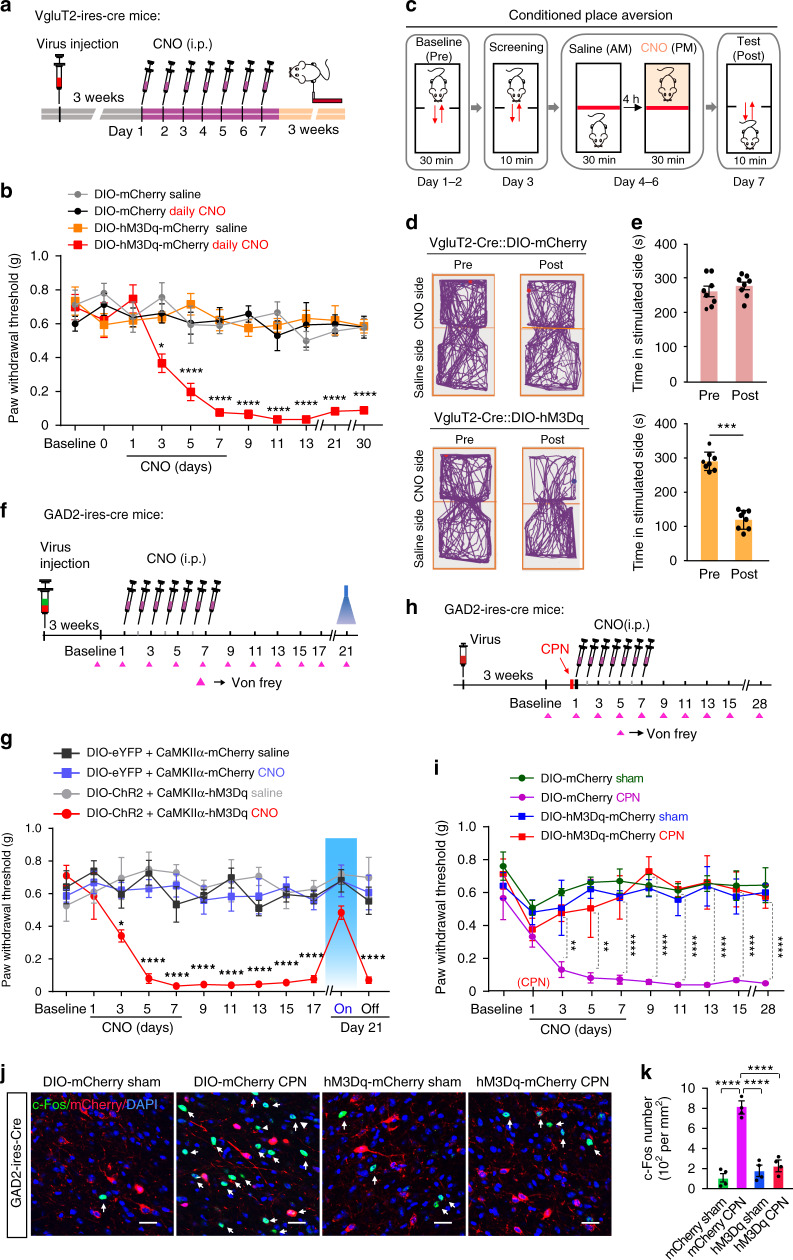
Fig. 9. Persistent activation of glutamatergic and GABAergic LPBN neurons, respectively, develops and prevents neuropathic pain-like hypersensitivity.
a Experimental design and timeline of the behavioral experiment. b Time-course of PWT changes induced by daily injection of CNO (i.p., 1.5 mg kg−1) for one week in VgluT2-ires-Cre mice. c Schematic of the experiment design for conditioned place aversion (CPA). d Examples of tracking maps in the CPA before (Pre) and after (Post) injection of CNO (i.p., 1.5 mg kg−1) into the LPBN of VgluT2-ires-Cre mice transfected with DIO-mCherry (upper) or DIO-hM3Dq-mCherry (lower). e Quantification of time spent in the preferred chamber as in d. f Experimental design and timeline of the behavioral experiment in GAD2-ires-Cre mice simultaneously transfected with two types of virus in the LPBN, one carrying DIO-eYFP (control) or DIO-ChR2-eYFP and the other carrying CaMKIIα-mCherry (control) or CaMKIIα-hM3Dq-mCherry. g Time-course of PWT changes induced by daily injection of CNO (i.p., 1.5 mg kg−1) for one week in GAD2-ires-Cre mice. A persistent decrease in PWT was induced only in mice injected with CNO and transfected with CaMKIIα-hM3Dq-mCherry, but not in the other groups. Note that illumination (473 nm, 40 Hz, 5 mW) of GABAergic LPBN neurons on day 21 reversibly elevated the PWT in mice transfected with DIO-ChR2-eYFP. h Experimental design and timeline of the behavioral experiment. i Daily injection of CNO for one week initiated on the same day as CPN ligation prevented the development of neuropathic pain-like hypersensitivity in mice transfected with DIO-hM3Dq-mCherry (red), but not in mice transfected with DIO-mCherry. j Representative images showing c-Fos expression (green, arrows) and GABAergic neurons transfected with mCherry or hM3Dq-mCherry (red) in the LPBN from Sham-operated and CPN-ligated mice. Scale bar, 30 μm. Blue, DAPI stain). k Quantification of c-Fos-positive cells in the LPBN from different groups as in j. All data are presented as mean ± s.e.m. and error bars represent s.e.m. *P < 0.05, **P < 0.01, and ****P < 0.0001. See also Supplementary Table 1 for further statistical information. Source data are provided as a Source Data file.

