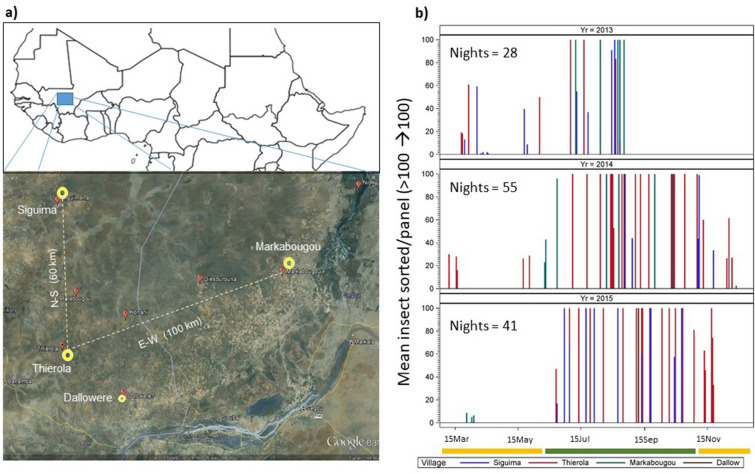
Figure 1.
(a) Map of study area (Map data: Google, Maxar Technologies) under a schematic map of Africa above the equator. The base map was generated using the ggplot2 package in R74, under a GPL-2 license. Aerial collection sites are shown in yellow with distance between them (the small symbol of Dallowere indicates that only two sampling nights in Dallowere were included in the present study). (b) Sampling effort of high-altitude flying insects by year. Needles represent sampling nights (by village: color) extending up to 100 insects per panel (actual number of insects can exceed 2000). Dry and wet seasons are indicated by yellow and green bands, respectively, under the x axis. Note: no sampling was done during January–February.

