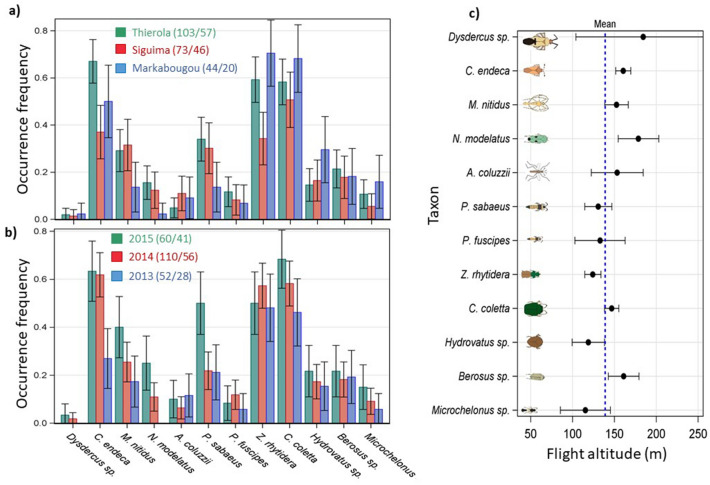
Figure 4.
Spatial and annual variation in high altitude migration. Mean frequency of occurrence (+ 95% CI) of each taxon per panel by (a) locality (excluding Dallowere which was sampled in only 2 nights) and (b) year. The sampling effort in each year with respect to nets and nights is given in the legend. Between-species variation in flight altitude measured as mean panel altitude (+ 95% CI) weighted by panel density (c). Dotted blue line shows mean panel altitude. Note: the highest panel was typically 190 m agl, but between August and September 2015 we used a larger helium balloon and the highest panel was set at 290 m agl (see Methods). Schematic insect silhouettes are not to scale.

