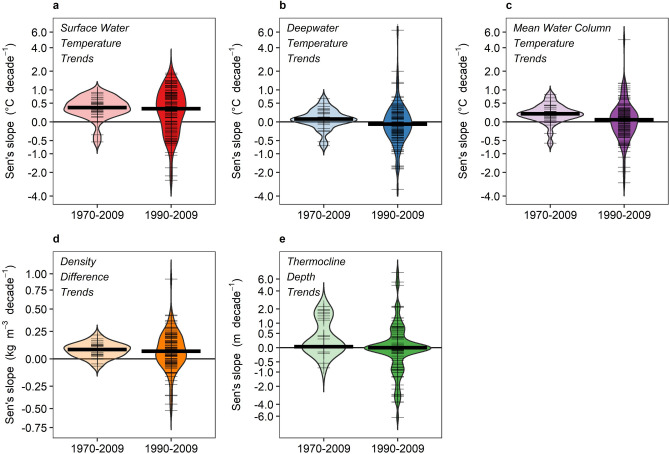
Figure 2.
Distribution of trends in thermal metrics across lakes. Paired violin plots of temporal trends in five lake thermal metrics from 1970–2009 (left of each panel) and from 1990–2009 (right of each panel): (a) surface water temperature, (b) deepwater temperature, (c) mean water column temperature, (d) density difference, and (e) thermocline depth. Note that y-axes are log-transformed based on the transformation in Eq. (2). Thick horizontal line indicates the median for the respective time period, and thin tick marks indicate trends for individual lakes. Panels (a–c) are all on the same y-axis scale.

