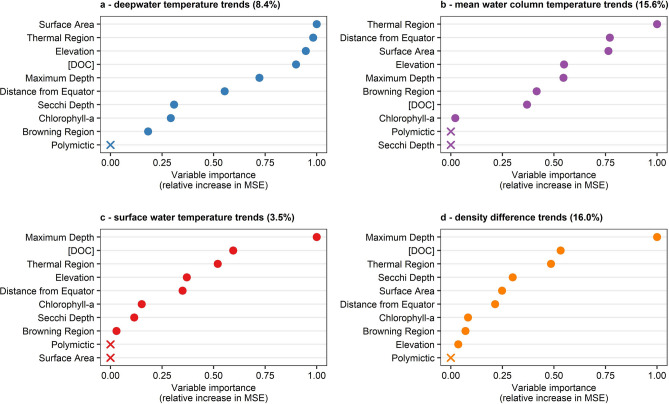
Figure 4.
Relative variable importance plots from random forest analysis for thermal metric trends. Relative variable importance for (a) deepwater temperature trends, (b) mean water column temperature trends, (c) surface water temperature trends, and (d) density difference trends. Solid circles in each panel indicate the relative increase in mean squared error (MSE) due to a random permutation compared to the most important variable, in order of decreasing importance. Variables marked with “X” had no increase in MSE and are statistically equivalent to random prediction. Random forest for thermocline depth resulted in 0% explanatory power, so no additional analysis was conducted.

