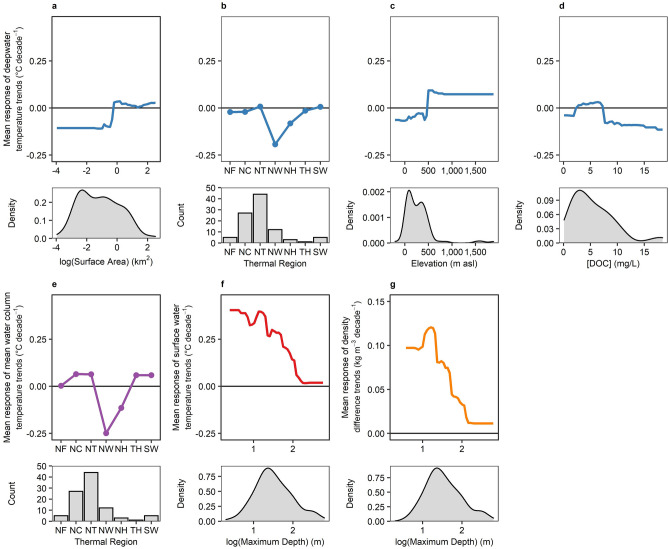
Figure 5.
Partial dependency plots of the most important variables from random forest analysis for thermal metric trends. In each lettered panel, the upper plot shows the mean response of each thermal metric vs. the predictor variable, with density distribution plots showing the observed range of the respective predictor variable in the lower plot. Deepwater temperature trends had four variables that were approximately equally important (a–d). Mean water column temperature trends (e), surface water temperature trends (f), and density difference trends (g) each had one variable that was clearly most important. Upper plots for (a) through (f) are all on the same y-axis scale. Horizontal lines mark zero, where responses greater than zero predict increasing trends and responses less than zero predict decreasing trends. Note that x-axes for surface area (a) and maximum depth (f,g) are on logarithmic scales. All density distribution plots follow the same x-scale as the corresponding partial dependency plot.

