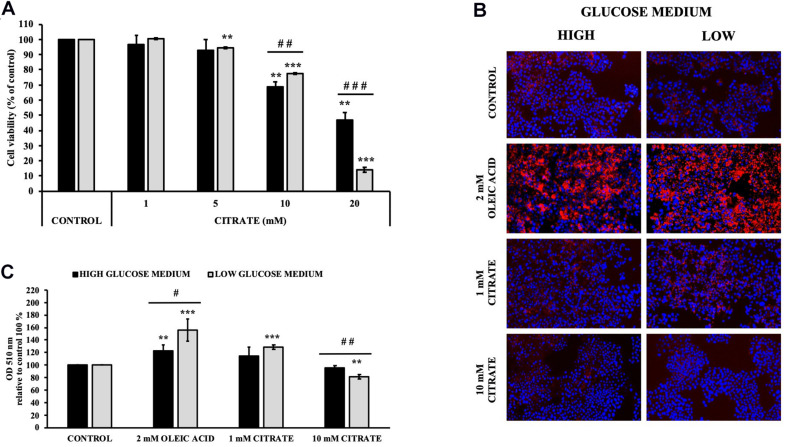
FIGURE 1.
Effect of citrate on HepG2 cell viability and lipid droplet accumulation. (A) Viability of Cells grown at 25 mM (black bars) or 5 mM (gray bars) glucose were treated with different concentrations of citrate (1, 5, 10, and 20 mM) for 24 h. Data were expressed as percentage of the control group and presented as means ± SD of three replicates from three independent experiments. **p < 0.01, ***p < 0.001 cells treated with citrate vs untreated control; ##p < 0.01, ###p < 0.001 cells grown in low-glucose medium vs cells grown in high-glucose medium. (B) Microscope images of HepG2 cells grown at 25 mM (high) or 5 mM (low) glucose, treated with citrate 1 and 10 mM for 24 h and stained with Oil Red O to detect hepatic lipid droplets (red). The nuclei were stained with 4′,6-diamidino-2-phenylindole (blue). Cells without citrate are considered as control. Oleic acid treatment (2 mM) was used as positive control of intracellular neutral lipids accumulation. (C) Lipid droplets were quantified at 510 nm. Data were expressed as percentage of the control group and presented as means ± SD of three replicates from three independent experiments **p < 0.01, ***p < 0.001 treated cells vs control cells; #p < 0.05, ##p < 0.01, cells grown in low-glucose medium (gray bars) vs cells grown in high-glucose medium (black bars).

