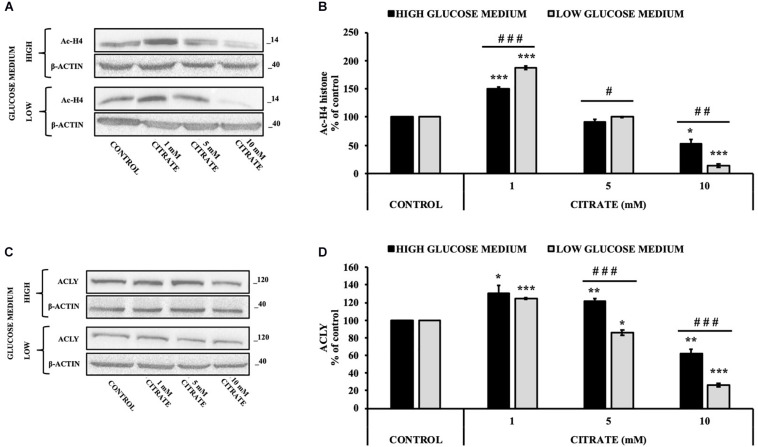
FIGURE 2.
Effect of citrate on the acetylation of histone H4 and ACLY expression. Representative western blot (A) and (B) densitometric analysis of the immunoreactive bands of Ac-H4 in HepG2 cells grown at 25 and 5 mM glucose in the presence of 1, 5, and 10 mM of citrate for 24 h. The Ac-H4 levels were normalized with β-actin content. The results from three independent experiments are presented as a percentage of acetylated histone H4 compared with 100% of the control cells. Data are shown as mean ± standard deviation (SD); ∗p < 0.05, ***p < 0.001 cells treated with citrate vs control cells; # p < 0.05, ##p < 0.01, ###p < 0.001 cells grown in low-glucose medium vs cells grown in high-glucose medium. Representative western blot (C) and (D) densitometric analysis of the immunoreactive bands of ACLY protein in HepG2 cells grown in high- and low-glucose medium and in the presence of 1, 5, and 10 mM of citrate for 24 h. The protein levels were normalized with β-actin content. The results from three independent experiments are presented as a percentage of ACLY protein levels compared with 100% of the control cells. Data are shown as mean ± SD, *p < 0.05, **p < 0.01, ***p < 0.001 cells treated with citrate vs untreated control; ###p < 0.001 cells grown in low-glucose medium vs cells grown in high-glucose medium.

