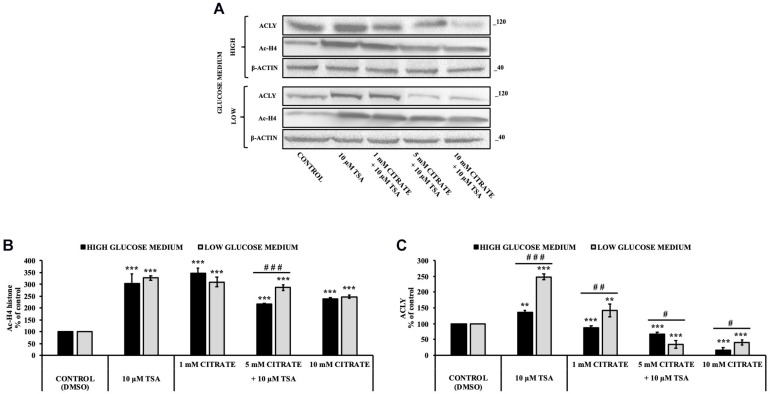
FIGURE 3.
Effect of Trichostatin A (TSA) on the acetylation of histone H4 and ACLY expression in HepG2 cells treated with citrate. (A) Representative western blot of Ac-H4 histone and ACLY protein in HepG2 grown in high- and low-glucose medium and in the presence of 10 μM TSA alone and in combination with 1, 5, and 10 mM citrate for 24 h. Densitometric analysis of the immunoreactive bands of (B) Ac-H4 histone and (C) ACLY protein in three independent experiments. The levels of proteins were normalized with respect to the β-actin protein levels. The results from three independent experiments of cells grown at 25 and 5 mM glucose are presented as a percentage of ACLY and Ac-H4 compared with 100% of the control cells treated with 0.15% dimethyl sulfoxide (control). Data are shown as mean ± SD, **p < 0.01, ***p < 0.001 cells treated with TSA vs control cells or cells treated with TSA in combination with citrate vs TSA alone; #p < 0.05, ##p < 0.01, ###p < 0.001 cells grown in low-glucose medium vs cells grown in high-glucose medium.

