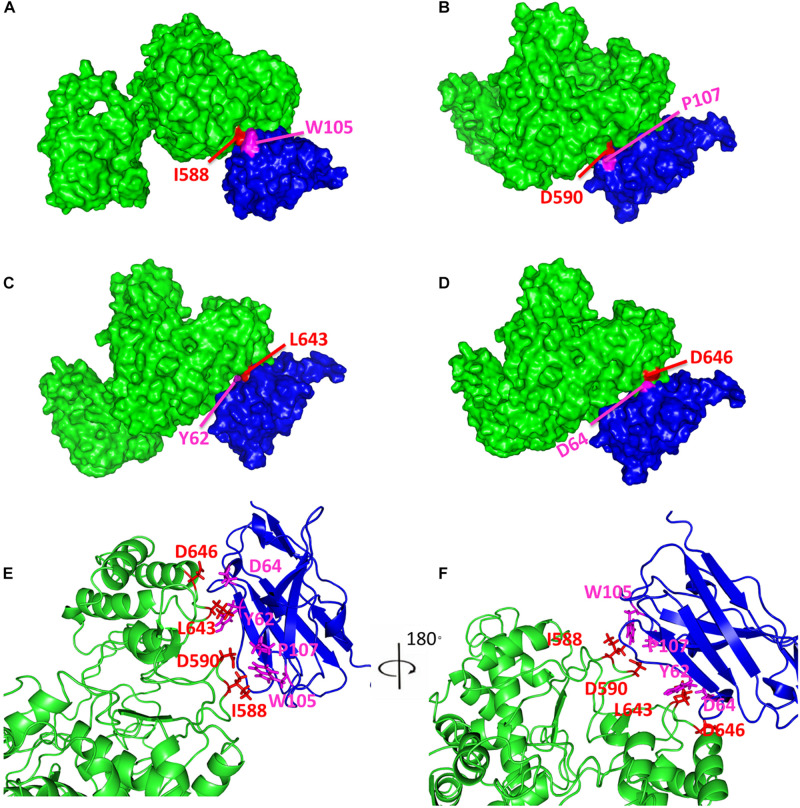
FIGURE 4.
Predicted model of Nsp9-Nb6 complex. The surface representations of Nsp9-Nb6 complex are shown in (A–D). Nsp9 is colored in green, Nb6 is in blue, Ile588 (A), Asp590 (B), Leu643 (C) and Asp646 (D) in Nsp9 are highlighted in red, Trp105 (A), Pro107 (B), Tyr62 (C) and Asp64 (D) in Nb6 are highlighted in magentas. (E,F) The predicted complex of Nsp9 and Nb6 are shown in cartoon diagrams.

