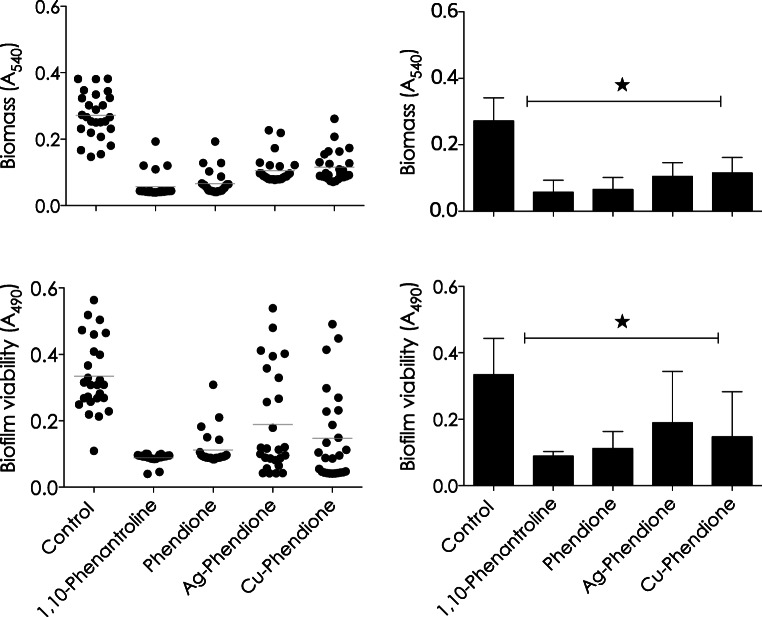
Fig. 1.
Effects of phen, phendione, Ag-phendione, and Cu-phendione on biofilm formation by 26 A. baumannii clinical strains. Biofilm biomass was measured by crystal violet incorporation and absorbance value at 540 nm (a and b), and cellular viability was quantified by XTT and absorbance value at 490 nm (c and d). The distribution of biofilm biomass (a) and viability (c) in each clinical strain regarding each analyzed system was plotted. In parallel, the values representing the mean ± standard deviation concerning biofilm biomass (b) and viability (d) for each analyzed system are also shown. The gray lines in a and c indicate the arithmetic mean of the production of biofilm in each system. Stars denote a significant difference between untreated and treated bacterial cells (P < 0.05; one-way ANOVA, Dunnett’s multiple comparison test)

