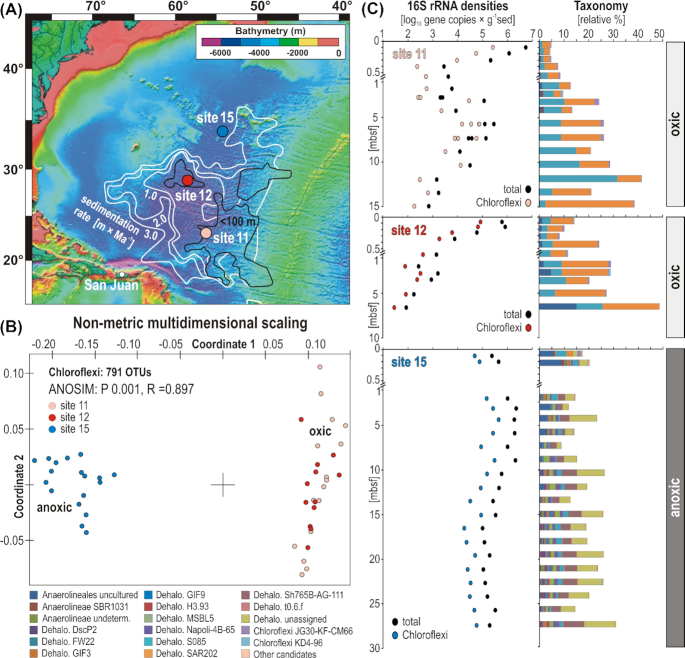
Figure 1.
Map of sampling sites with bathymetry and sedimentation rate, and characterization of Chloroflexi in terms of beta diversity, density and taxonomy at the three sites. (A) Map of subseafloor sedimentation rate (modified after D'Hondt et al. 2015) with location of the three sampling sites. (B) Non-metrical dimensional scaling (NMDS) plot based on all OTUs assigned to Chloroflexi across the three sites. (C) Quantitative polymerase chain reaction (qPCR) of total (black dots) and qPCR- normalized to Chloroflexi (colored dots) 16S rRNA genes [gene copies/g sed], and Chloroflexi taxonomic assemblages [relative %].

