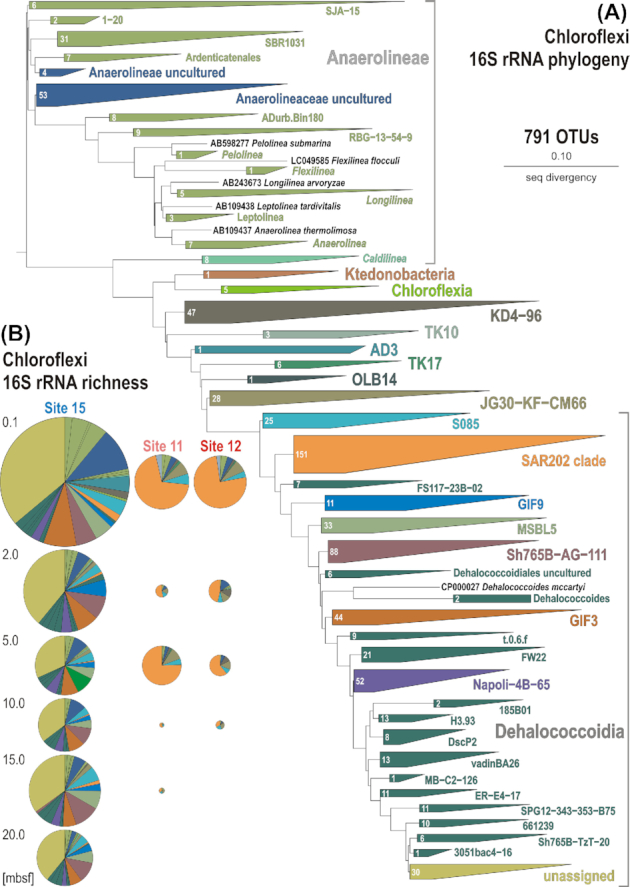
Figure 2.

Phylogenetic analysis of 16S rRNA genes (V4 hypervariable region). (A) Phylogenetic tree obtained for all operational taxonomic units (OTUs) assigned to Chloroflexi in this study. (B) Pie charts displaying 16S rRNA gene richness of the whole assemblage of Chloroflexi for each of the three sites and at each sediment depth. The radii of pie charts are proportional to the number of OTUs. The clockwise color coding in the pie charts matches that of the phylogenetic tree from top to bottom, and bar charts from left to right (Fig. 1).
