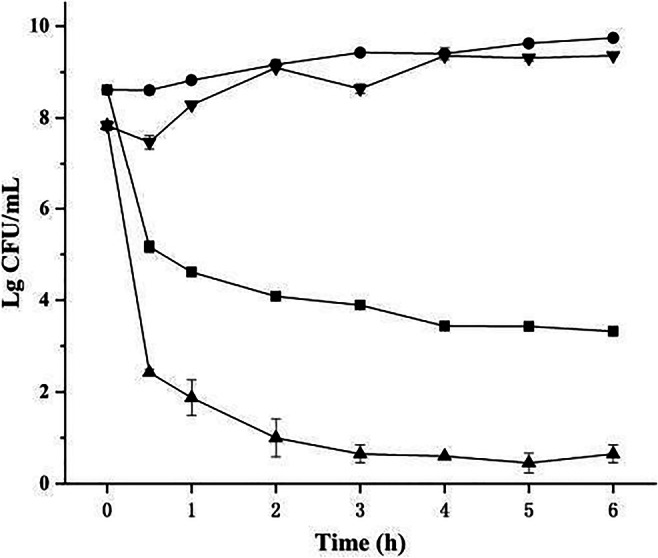
Fig. 3.

Time-kill curve against S. aureus (circle is the control, and square is treated by BM1300 at 2 × MIC) and E. coli (inverted triangle is the control, and triangle is treated by BM1300 at 2 × MIC). Data are expressed as mean ± SD. Each individual treatment is run in triplicate
