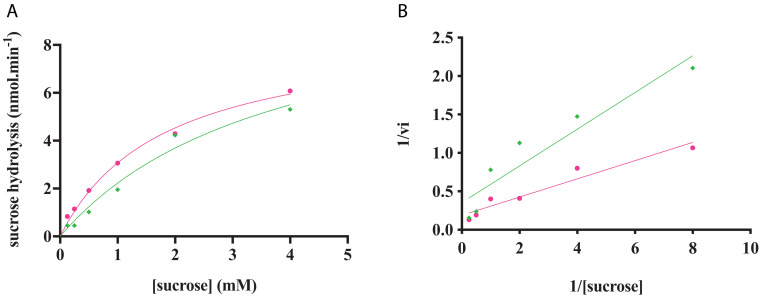
FIGURE 8.
RgAgaSK and RgSK kinetics toward sucrose. The phosphorylation rate of sucrose by RgAgaSK (in green) and RgSK (in pink) was evaluated by using the representation of Michaelis-Menten (A) and Lineweaver Burk (B) plot. The proteins (50 nM) were incubated with varying concentrations of sucrose ranging from 0 to 4 mM for 5 min at 30°C. The values are the average of three different assays.

