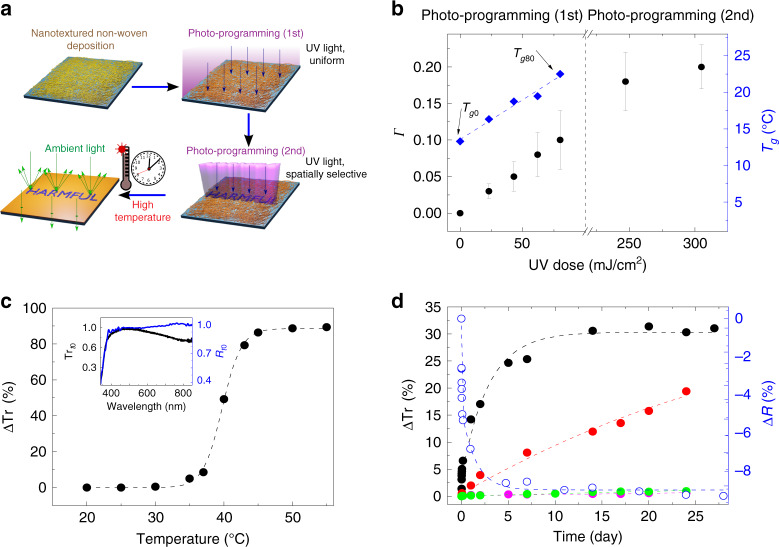
Fig. 1. Photo-programming of thermal properties.
a Schematic representation of the indicator photo-programming. SU-8 fibrous non-woven deposition and photo-programming (blue vertical rays) at calibrated optical dose and pattern activation. A warning sign will appear when the subsequently experienced time–temperature profile overcomes targeted programmed values (i.e., correct item storage conditions) by diffuse reflectance contrast (green rays). b Calculated average values of the cross-linking degree, Γ, at different exposure doses during photo-programming (left vertical scale). Data are averaged over at least three samples for each dose (error bars: SD). DSC inflection points (Tg, right vertical scale) for the non-woven fabrics following the first step of photo-programming at different UV doses are also displayed. The blue line is a linear fit to the experimental data (diamonds). Tg0 and Tg80 refer to samples photo-programmed (step 1) with UV doses: 0 and 80 mJ/cm2, respectively. c Optical transmission change (dots, ΔTr) at λ = 510 nm, vs. temperature, for a fabric with first step of photo-programming at 80 mJ/cm2. The dashed line is a guide for the eye. Inset: Normalized Trt0 (black line, left vertical scale) and Rt0 (blue line, right vertical scale) spectra. Trt0 and Rt0 are the optical transmission and the diffuse reflectance measured at t0 = 0, respectively. Rt0 was measured by means of an integrating sphere (see Methods). d Temporal variation of ΔTr (at λ = 510 nm, left vertical scale) for samples kept at Tamb (~ 20 °C, pink dots), 25 °C (green dots), 30 °C (red dots) and 35 °C (black dots). The corresponding optical reflectance change, ΔR (at 510 nm, empty dots, right scale), vs. time is also shown for samples at 35 °C. Dashed lines are guides for the eye.

