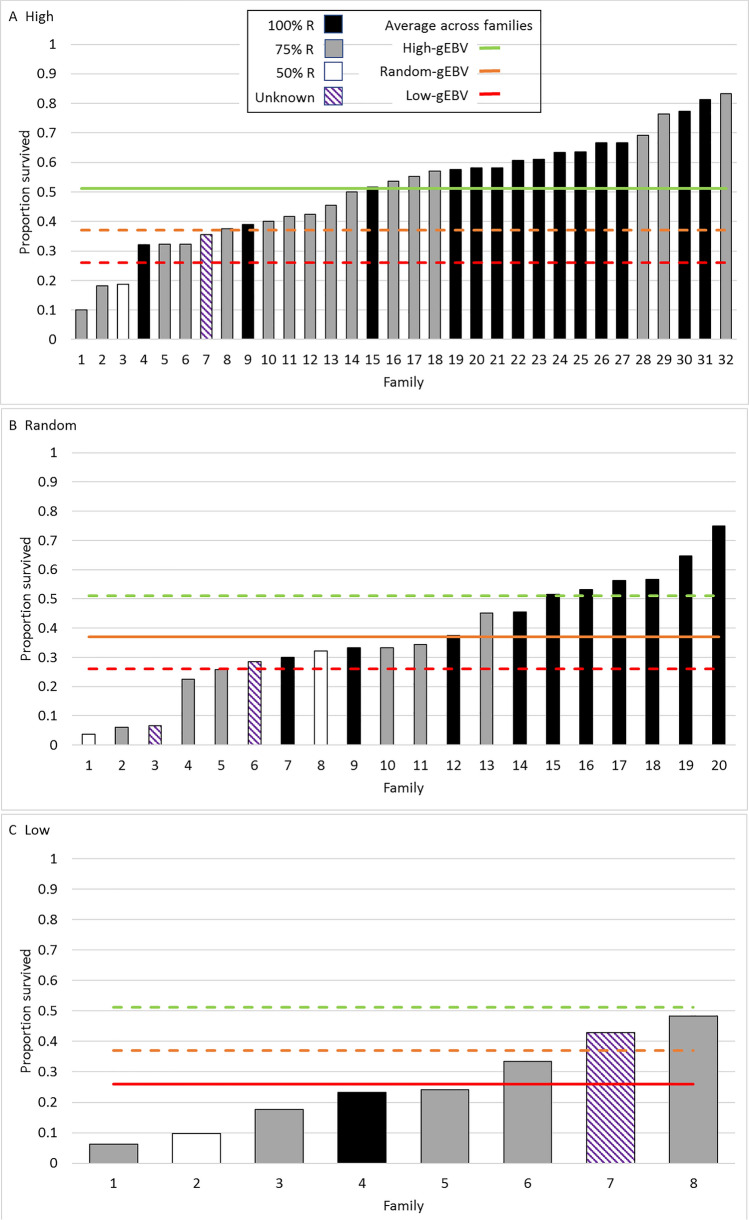
Figure 3.
Proportion surviving in each challenged family for high (A) random (B) and low (C) gEBV selected G1 groups. Shading of the bar plots indicates % of resistant line ancestry in that family (black 100%, grey 75%, white 50% and stripes when the population origin of one parent was unknown. Horizontal lines show the average proportion across families surviving for the high (green), random (orange) and low (red) gEBV G1 groups. Solid lines relate to the G1 population that is represented in each plot.

