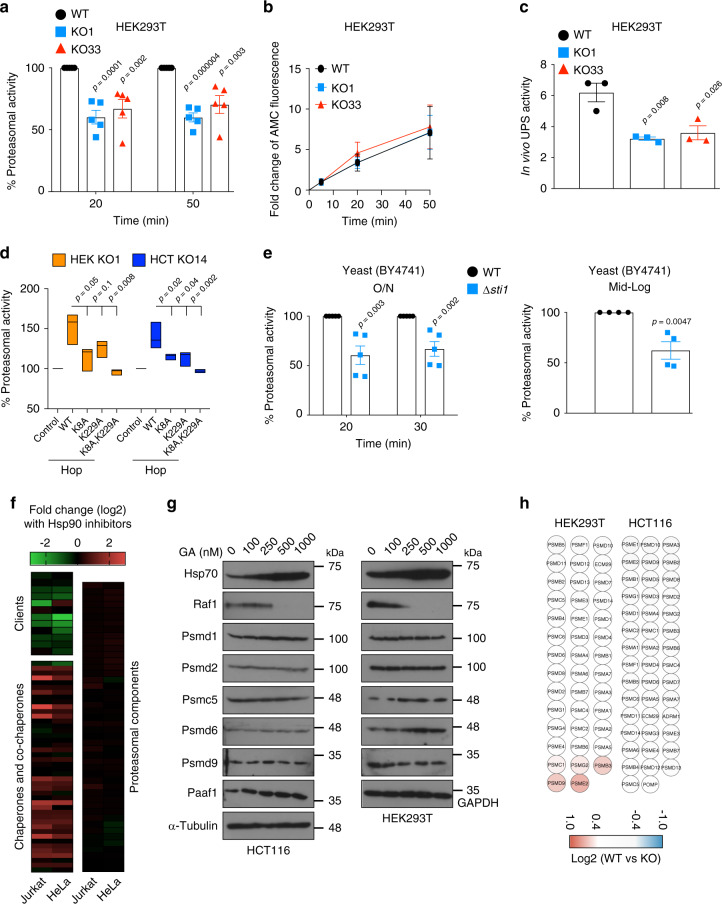
Fig. 4. The Hsp70-Hop-Hsp90 ternary complex is required for proteasomal activity.
a In vitro steady-state proteasomal activity with cellular extracts at the indicated time points after initiation of the reaction with the reporter substrate suc-LLVY-AMC. Activity of WT cells was set to 100% for each time point (n = 5 biologically independent samples). b Rate of proteasomal activity determined with suc-LLVY-AMC. The AMC fluorescence at 5 min was set as base value, and all other time points normalized to that (n = at least 5 biologically independent samples). c Flow cytometric determination of in vivo UPS activity using the Ub-M-GFP and Ub-R-GFP reporter plasmids (n = 3 biologically independent samples). d In vitro steady-state proteasomal activity of extracts from KO cells overexpressing WT or TPR mutant Hop. The activity of mock transfected KO cells was set to 100%. HEK (n = 3 biologically independent samples) and HCT (n = 4 biologically independent samples), HEK293T and HCT116, respectively. e In vitro steady-state proteasomal activity of extracts of overnight (O/N, left panel; n = 5 biologically independent samples) and mid-log phase (right panel; n = 4 biologically independent samples) cultures of STI1 (WT) and Δsti1 yeast cells (strain BY4741). Activity of WT cells was set to 100% for each time point. f Heat maps of normalized fold changes of the levels of Hsp90 clients and co-chaperones, and proteasomal components in Jurkat and HeLa cells treated with the Hsp90 inhibitors geldanamycin (20 h) and 17-DMAG (24 h), respectively. These MS data are from previous publications42,43. Overexpressed and downregulated proteins are in red and green, respectively. g Immunoblots of proteasomal subunits from GA-treated WT cells; Hsp70, Raf1, and α-tubulin serve as controls. h Heat maps of the normalized fold changes of the levels of proteasomal proteins identified by whole-cell MS analyses. The scale bar represents the log2 fold changes (WT vs KO) of the LFQ values. For the bar and line graphs, the data are represented as mean values ± SEM. For box plots, data are represented as the median values and edges of the box plots represent the range of the data. The statistical significance between the groups was analyzed by two-tail unpaired Student’s t-tests. Source data are provided as a Source Data file.

