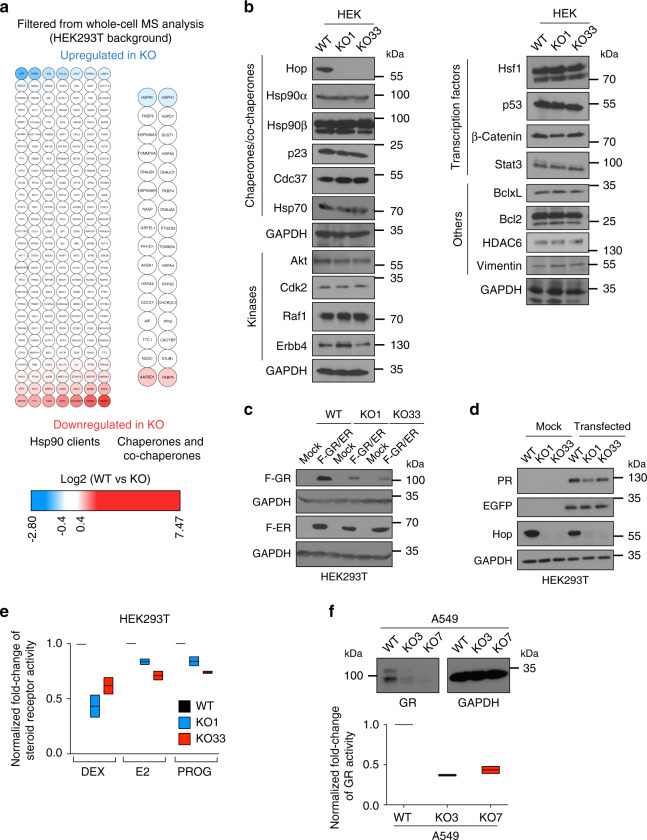
Fig. 7. Hop KO only affects few specific Hsp90 clients.
a Heat maps of the normalized fold changes of the levels of Hsp90 clients (left), and molecular chaperones and co-chaperones (right) identified by whole-cell MS analyses. b Immunoblots of Hsp90 clients, Hsp90 partners and co-chaperones (n = 3 independent experiments). c Immunoblots of Flag-tagged GR (F-GR) and estrogen receptor α (F-ER) overexpressed in HEK293T cells (n = 2 independent experiments). d Immunoblots of the progesterone receptor (PR) overexpressed in HEK293T cells (n = 2 independent experiments). e Transcriptional activities of overexpressed GR (induced by dexamethasone (DEX)), ERα (induced by β-estradiol (E2)), and the PR (induced by progesterone (PROG)), as assayed with specific luciferase reporter genes (n = 2 biologically independent samples); data are represented as fold change relative to those of WT cells (set to 1). f Immunoblot of the endogenous levels of GR (top, n = 2 independent experiments), and its DEX-induced transcriptional activity determined with a transfected luciferase reporter (bottom, n = 2 biologically independent samples). For box plots, data are represented as the median values and edges of the box plots represent the range of the data. Source data are provided as a Source Data file.

