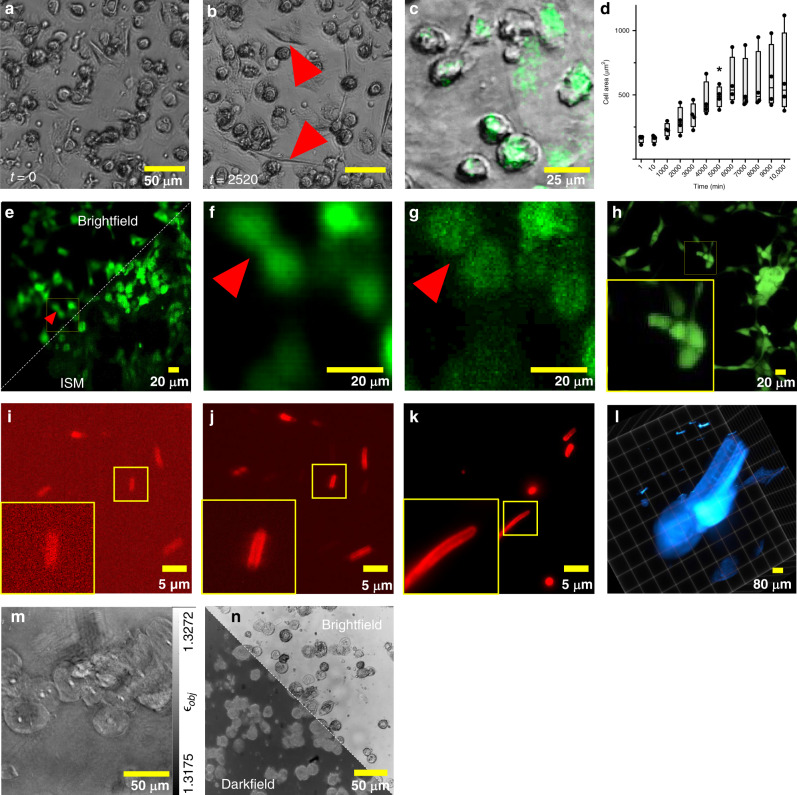
Fig. 3. UC2 imaging modalities.
a, b Variation in macrophage’s morphology, where elongated cells are clearly visible after 42 h (red arrow) imaged in transmission mode. c The bright-field channel superposed with a fluorescent signal of fixed macrophages labeled with CellTracker green captured with the incubator-enclosed microscope. d the growth of a differentiating cell is plotted as the average area of cells across multiple time-steps and different experiments (n = 4). Whisker plots: 10th − 90th percentile, the box represents the 25th and 75th percentile with the line in the box marking the median. Statistical testing with one-way ANOVA and Tukey’s correction with GraphPad Prism (GraphPad, CA, USA), p = 0.034 (F = 10.76, DF = 11). Data of four independent experiments is shown. e Wide-field fluorescence (top-left) and the computed “superconfocal” result (bottom-right) of GFP-labeled Human Pulmonary Microvascular Endothelial Cells (HPMCs) illuminated with a laser-scanning projector, recorded with a cellphone camera. The zoomed-in images show the improvement of the optical sectioning in the case of structured illumination (g) compared to wide-field (f), where smaller cell-structures are lost. h A comparison of the same sample acquired with a commercial laser-scanning confocal microscope. A benchmark from the infinity-corrected fluorescence microscope using the Raspberry Pi (i) and cellphone camera (j) and a research-grade microscope (k) of mCLING-ATTO 647N labeled fixed E. coli bacteria, where the cellphone clearly resolved the bacterial membrane. l A Z-stack of a GFP-expressing zebrafish acquired with the UC2-light sheet. m Using an LED-ring as the illumination enables quantitative phase imaging of cheek cells using annular Intensity Diffraction Tomography (aIDT). n LED matrices can rapidly switch between bright- and dark-field imaging as shown in (n).

