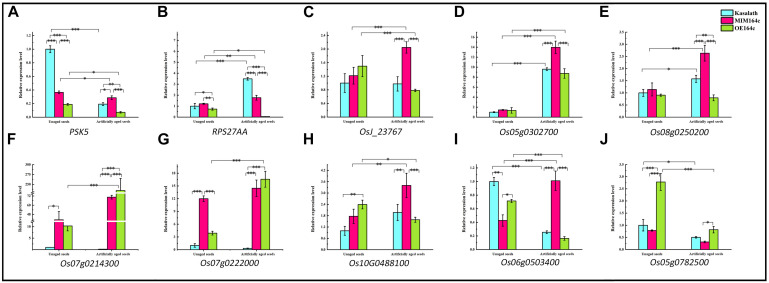
FIGURE 12.
RT-qPCR assay of the expression level of 10 genes in WT, ST, and OT seeds before and after artificial aging. (A–C,H) Core genes in the interaction network in Figure 9. (C–E) Genes related to energy metabolism. (F,G) Genes corresponding to serine-type endopeptidase inhibitors. (H–J) Stress-related genes. Data represent mean ± SD (n = 3). Significant differences in gene expression levels among the three rice genotypes were determined by Tukey’s test (∗P < 0.05, ∗∗P < 0.01, ∗∗∗P < 0.001). The expression level of each gene in unaged WT seeds was defined as 1.

