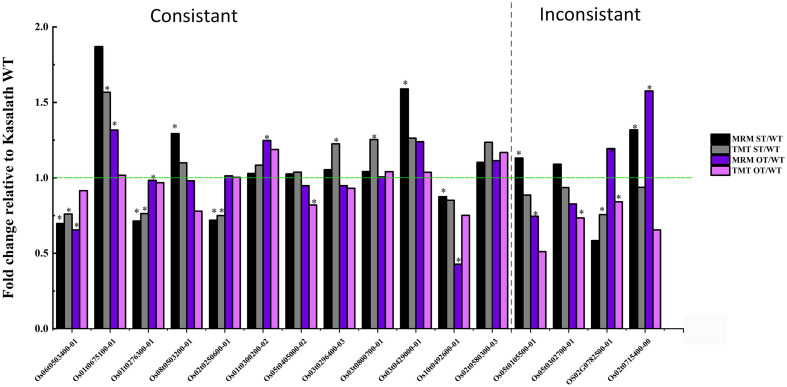
FIGURE 13.
Comparison of the quantitative data of 16 rice seed proteins between MRM-MS and TMT assays. Data represent the mean of three technical replicates. Asterisk (∗) indicates the significant difference (a linear mixed-effects model was used for MRM data and a paired t-test for TMT data) in the protein expression level between transgenic and WT seeds (P < 0.05). The expression level of each protein in WT seeds was defined as 1.

