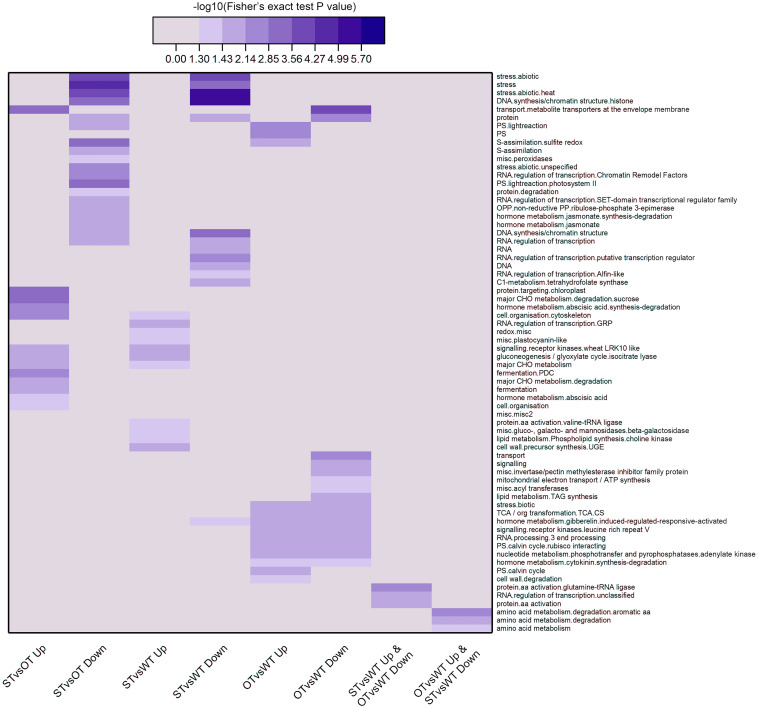
FIGURE 5.
Clustering analysis of the results of MapMan pathway enrichment of genes corresponding to the DEPs identified in the WT, ST, and OT seeds. The darker the color, the more significant the degree of enrichment. The DEPs were selected based only on fold-change (FC > 1.3 or < 1/1.3), and not on the basis of the P-value.

