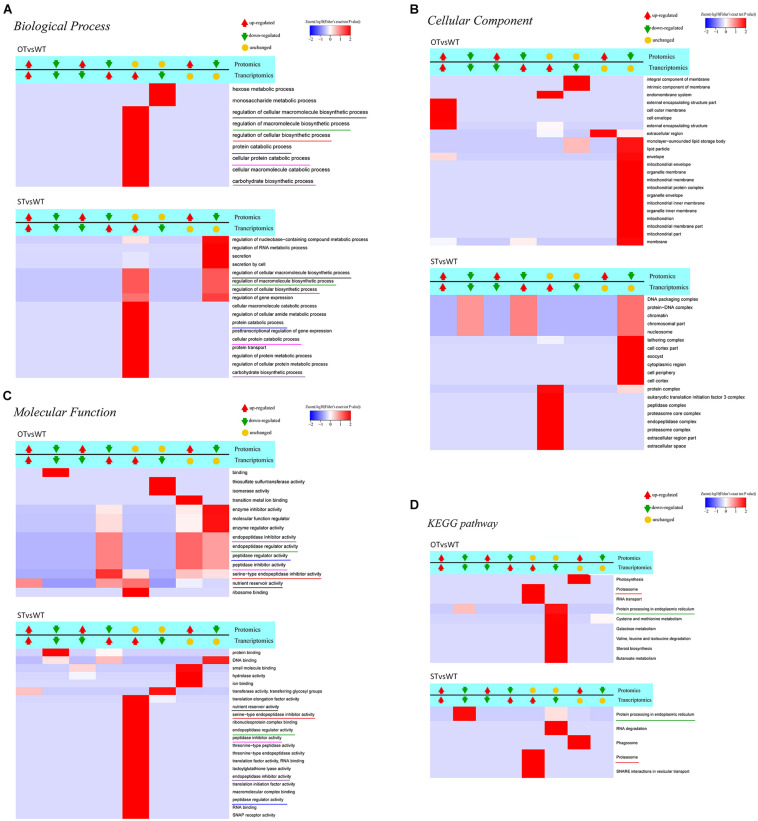
FIGURE 7.
Clustering analysis of the results of functional enrichment of DEGs/DEPs identified by transcriptome–proteome correlation analysis. The common GO terms and KEGG pathways in the STvsWT and OTvsWT groups are underlined by the same color. The darker the red color, the more significant the degree of enrichment. (A–C) The GO categories Biological Process, Cellular Component, and Molecular Function, respectively. (D) represents the KEGG pathway enrichment of DEGs.

