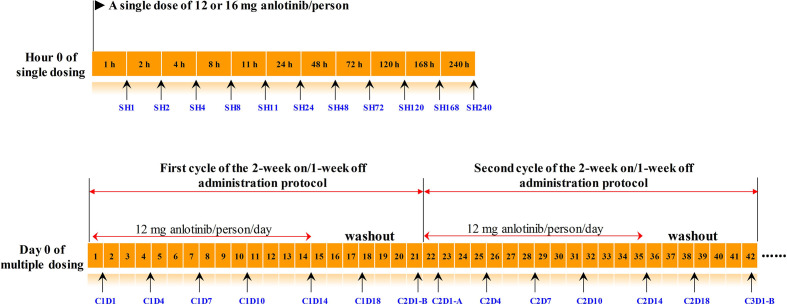
Figure 1.
The timeline of drug administration and blood collection. Numbers in the orange boxes represented the time. The black arrows below the timeline indicated the points at which the blood samples were collected, and the blue texts indicated the corresponding sample number. The upper panel was timeline of the single-dose study, and the lower panel was timeline of the multiple-dose study. C2D1-B and C2D1-A represented the time points 24 h before and 24 h after the first administration in the second cycle, respectively.

