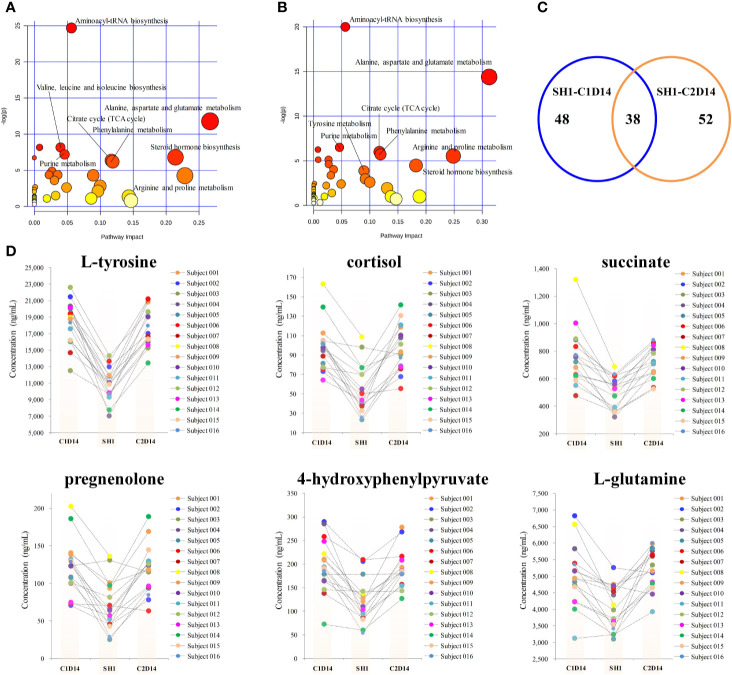
Figure 3.
Metabolic phenotype variations induced by anlotinib treatment. (A) Overview of pathway analysis of the significantly changed metabolites between SH1 and C1D14. (B) Overview of pathway analysis of the significantly changed metabolites between SH1 and C2D14. All dots represented matched pathways from topology pathway analysis. Pathways were colored according to their significance values from pathway enrichment analysis, with gradations from yellow, having the least significance, to red having the highest significance. (C) A Venn diagram showing the shared metabolite numbers between SH1-C1D14 and SH1-C2D14. (D) Concentration trends of six metabolites on the time points of SH1, C1D14, and C2D14.

