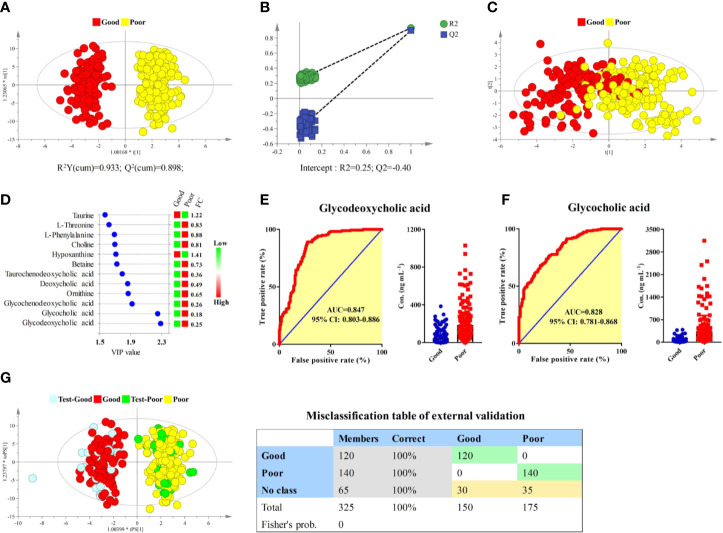
Figure 5.
Identification of potential biomarkers associated with the efficacy of anlotinib. (A) OPLS-DA score plot of good and poor efficacy groups based on concentrations of all metabolites. (B) Random permutation test with 100 iterations. (C) PCA score plot of good and poor efficacy groups based on concentrations of the 12 metabolites with VIP > 1.5. (D) Compound names, VIP values, and FCs of the 12 metabolites with VIP > 1.5. (E) ROC and box plot of glycodeoxycholic acid. (F) ROC and box plot of glycocholic acid. (G) External validation of the OPLS-DA model. Samples in the discovery set were designed as good or poor groups, while samples in the validation set were designed as test-good or test-poor groups. Both depended on the best curative effect.

