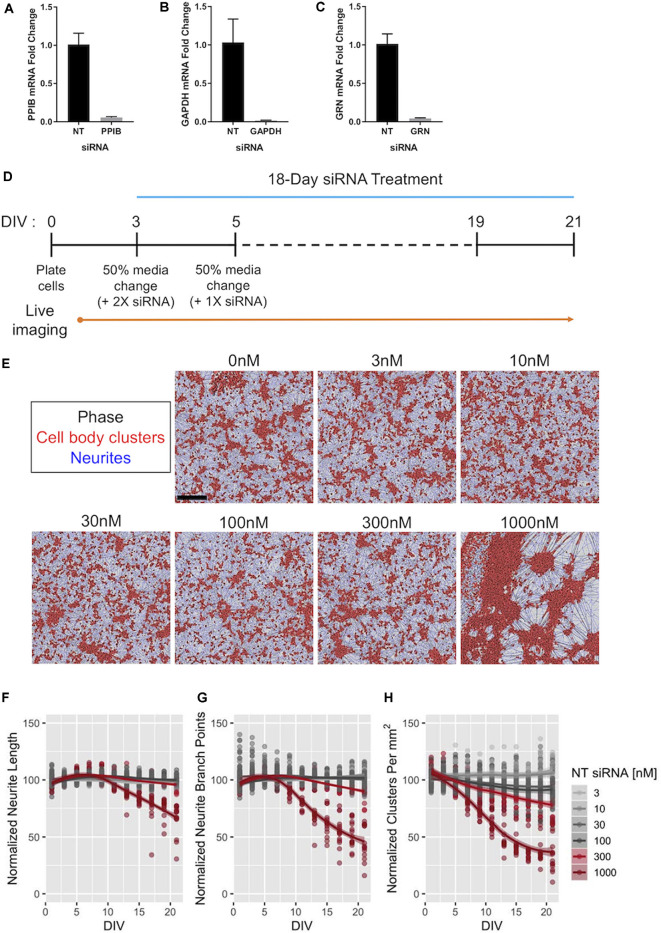
Figure 6.
Efficacy of Accell™ siRNA-mediated gene knockdown in human iPSC neurons. (A–C) Expression of PPIB (A), GAPDH (B), and GRN (C) mRNA in GNs after 72-h exposure to 1 μM of siRNAs targeting the indicated gene. The expression levels were compared to those in GNs treated with 1 μM of pooled non-targeting (NT) siRNAs. Expression was detected using qPCR with 18S rRNA as an internal control (n = 3 independent replicates per group). (D) Schematic of the protocol for long-term treatment of self-delivering Accell™ siRNAs to GNs. Dashes represent 50% media changes (with 1× siRNA treatments) every other day. (E) Representative images taken at DIV21 of GNs repeatedly exposed to the indicated concentrations of NT siRNA per the protocol in panel (D) neurite masking by NeuroTrack™ software is shown for neurites (blue) and cell-body clusters (red). Scale bar, 300 μm. (F–H) NeuroTrack™ quantification of neurite length (F), neurite branch points (G), and cell-body clusters (H) in cells treated with the indicated concentrations of NT siRNA until DIV21. The data were collected for nine independent experiments (n = 183 untreated wells, n = 120 wells treated with 30 nM, and n = 15 wells for remaining concentrations). All measurements were normalized to the mean of the untreated cells per recording for each experiment. Solid lines show a LOESS fit of the data, and the shaded area represents the 95% confidence intervals of the model (when large enough to display). The concentrations displayed in red were significantly different than untreated cells at DIV21 [padj < 0.05, Tukey’s Honest Significant Difference (HSD) test].

