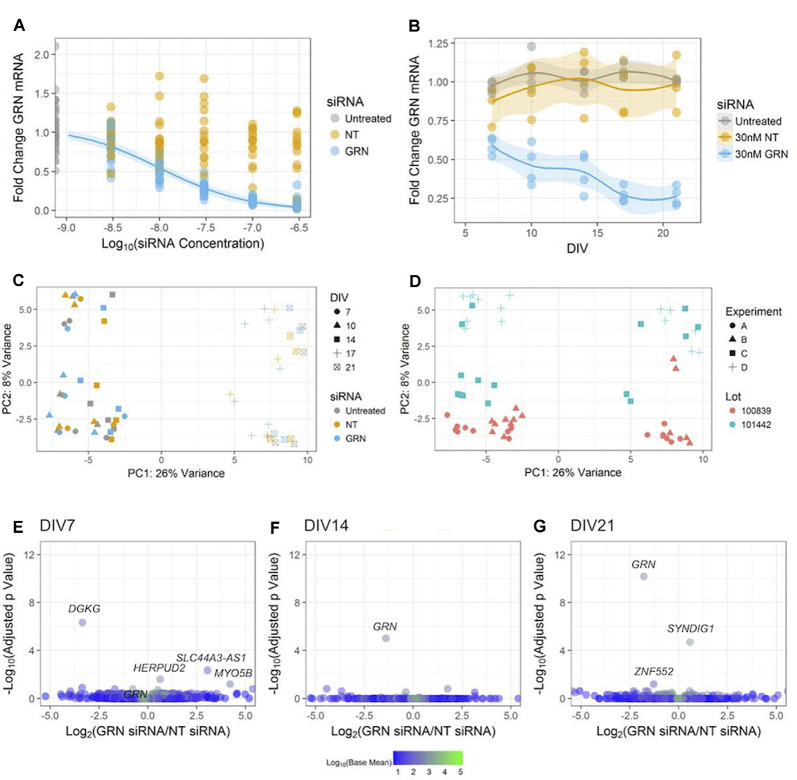
Figure 7.
Reducing GRN expression in human iPSC neurons to model FTD. (A) GRN mRNA levels were determined using qPCR (with ACTB as a reference gene) following 18 days of treatment with the indicated siRNA concentrations. A three-parameter log-logistic model, with a bottom set to zero, was fit to the GRN siRNA data and is displayed as a blue line along with 95% confidence intervals. No model converged for the NT siRNA data. Untreated and GRN siRNA data come from seven independent experiments (n = 36 untreated wells and 105 GRN siRNA wells), while the NT siRNA data come from five independent experiments (n = 75 wells). Gene expression data are not displayed for the highest dose of siRNA used in Figures 5E–H due to toxicity. (B) GRN mRNA expression levels measured using qPCR in GNs treated with 30 nM siRNA and collected at DIV7, 10, 14, 17, and 21 (n = 4 independent replicates per time point for each treatment). The solid line shows a LOESS model of the data, with the 95% confidence intervals displayed in the shaded areas. The mean of ACTB, PPIB, and GAPDH expression was used for the reference. (C,D) Principle component analysis of RNA-Seq data from the cells treated with siRNA and collected at DIV7, 10, 14, 17, and 21 (n = 60 samples). The data are displayed according to shape (indicating the DIV) and color (indicating the siRNA) in (C), while (D) shows the data with the shape indicating the experiment and the color indicating the cell lot number. (E–G) Volcano plots of RNA-Seq data comparing 30 nM of either NT or GRN siRNA at DIV7, 14, and 21. Each plot displays 16,591 genes colored according to the mean of their normalized count values across all samples (n = 4 independent replicates per siRNA). The labeled points were statistically significant (padj < 0.1), except for the GRN point labeled in the DIV7 plot.

