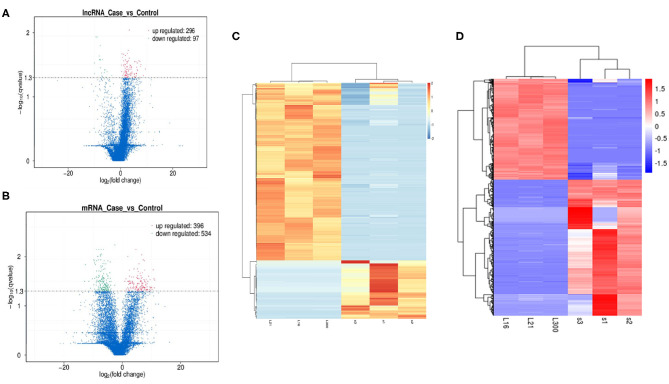
Figure 4.
Exploration of Differentially expressed (DE) lncRNAs and mRNAs in OP vs. NC and functional analyses. (A) Detection of the DE lncRNAs in volcano plot. Up-regulated lncRNAs (FC ≥ 2, P < 0.01) are labeled red, whereas down regulated lncRNAs (FC ≤ 0.5, P < 0.01) are labeled green. (B) Detection of the DE mRNAs in volcano plot. Up-regulated lncRNAs (FC ≥ 2, P < 0.01) are labeled red, whereas down regulated lncRNAs (FC ≤ 0.5, P < 0.01) are labeled green. (C) Heat map analysis of DE lncRNAs in OP vs. NC. The heat map was generated by hierarchical analysis of lncRNAs and samples. The heat map was generated by hierarchical analysis of lncRNAs and samples. (D) Heat map analysis of DE mRNAs in OP vs. NC. The heat map was generated by hierarchical analysis of mRNAs and samples. The red and blue represented up-regulated and down-regulated transcripts, respectively.

