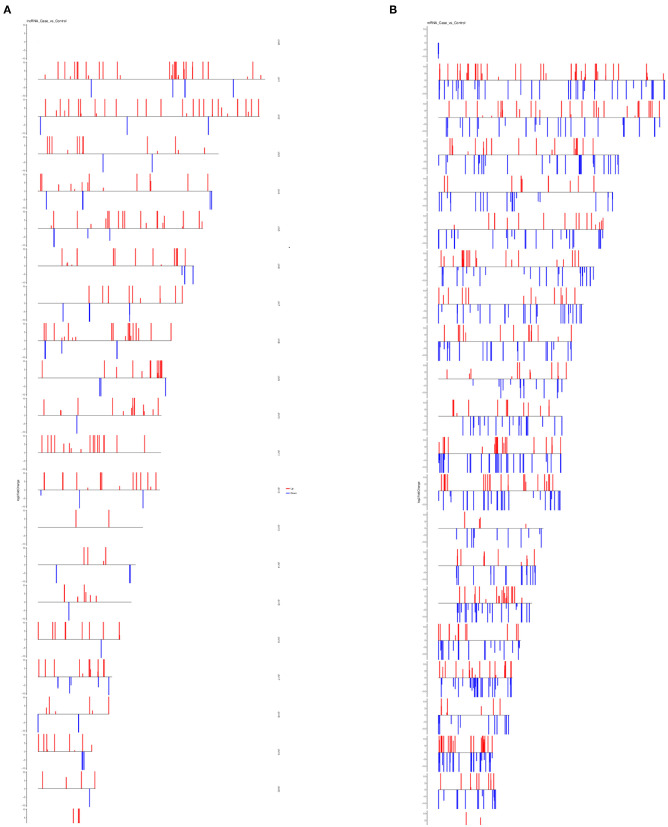
Figure 5.
Chromosomal distribution of differentially expressed lncRNAs and mRNAs. (A) Distribution of differentially expressed lncRNAs on all chromosomes in the human genome. (B) Distribution of differentially expressed mRNAs on all chromosomes in the human genome. For both plots, red bars represent upregulated transcripts and blue bars represent downregulated transcripts.

