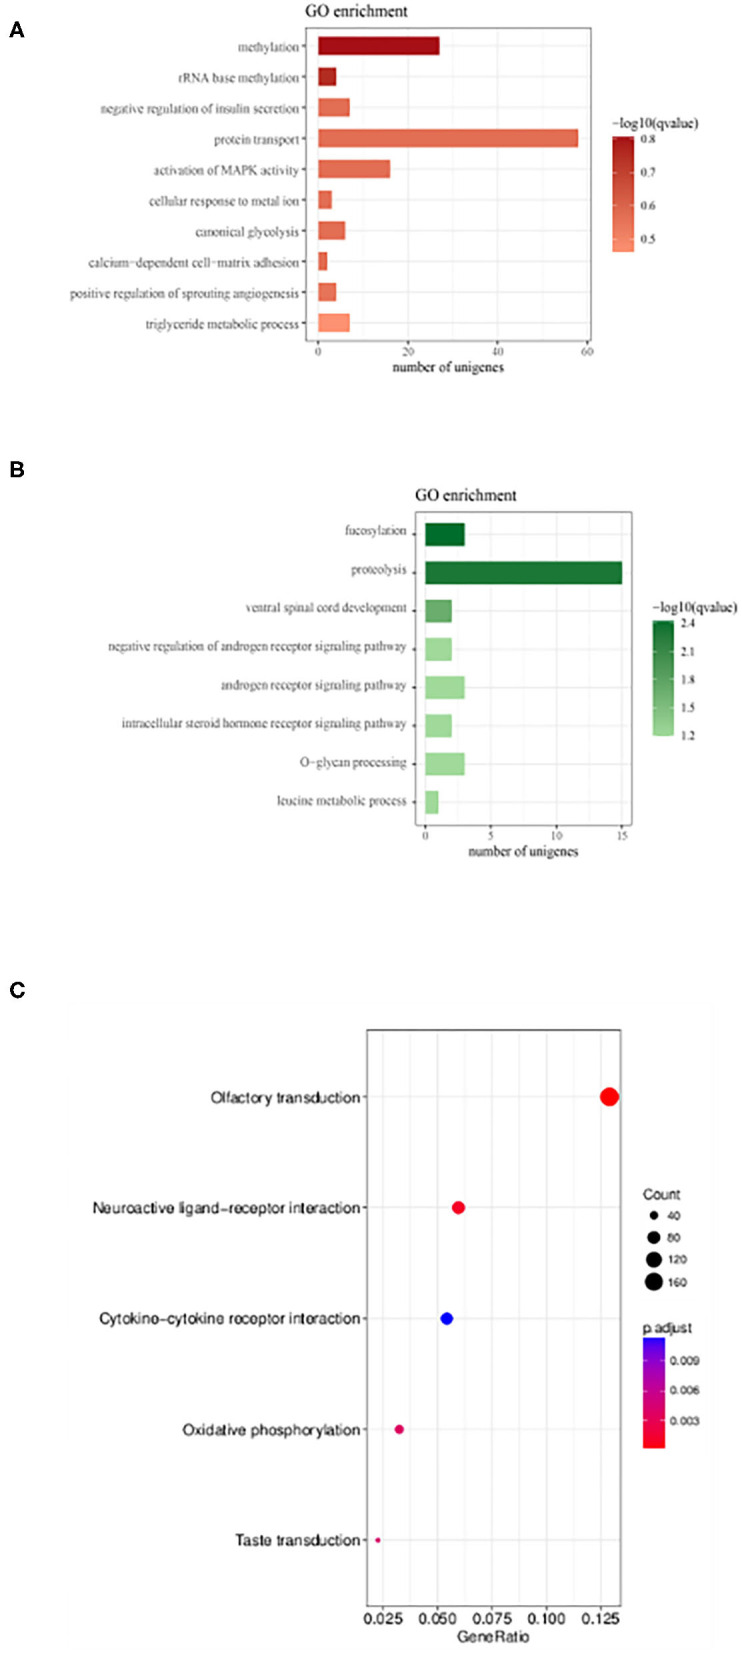
Figure 6.

Gene Ontology enrichment and KEGG pathway analysis lncRNAs target genes. (A,B) GO analysis of genes which were putative regulated by up-regulated and down-regulated DE lncRNAs, respectively. Also, see Supplementary Tables 1, 2 for the list of genes. (C) KEGG enrichment scatter plots of differentially expressed lncRNA target genes (Supplementary Tables 3, 4).
